
List members , prepare to be SHOCKED by what follows below - take a deep breath and stay calm :)) Please suspend your disbelief , because this comprehensive MATHEMATICAL analysis (it's NOT just idle speculation without any basis) looks so logical , that for the first time I'm myself inclined to reconsider "Crustal Displacement Theory". It gives a whole new meaning to "Finding TRUE NORTH" :-
Antiquity Reborn
Mathematical Holistic Orientation-based Dating Method
Why the Orientation of Pyramids Correlates with Ice Ages
Orientation patterns of more than 960 ancient pyramids, sites, and temples, randomly spread around the world, correlates with the temperature changes of the last series of glaciation cycles. Most ancient monuments are hundreds of thousands of years old. Renovations of ancient monuments were done on top of their much older foundations, leaving most of the original orientations intact. The orientation of ancient monuments is, beyond any doubt, a very potent mathematical data analysis tool, revealing an astounding, inescapable truth.

Fig 1: This animation shows how the crustal displacements relate to the glaciation graphs. The relation between the size and extent of the shifts and the large temperature swings to be just coincidental is 1 to 256 or 0.39%. When we further zoom in on the variables of natural temperature changes and crustal deformation temperature changes we find a probability of 1 to 750,000 for this to match so perfectly within a certain margin of error. This almost perfect match in a complex of systems is the mathematical proof of multiple crustal shifts in the ancient past. Note that the time between the stable poles, the duration of crustal deformations, stretches out over tens of thousands of years. The deformation process proceeds VERY SLOWLY but faster than the current plate tectonics models. That means that the deformation cycles are non-lineair. | © Mario Buildreps.
Why Orientation is the Key to Unlock Ancient Mysteries
The orientation of a building is purely mathematical because orientation is dimensionless, i.e., not physical. While the size, weight, or chemical composition of a structure might change, its orientation is, by definition, independent of material properties.
Many astronomical, religious, and even political buildings, like the pyramids of Giza, the Yerkes Observatory, the White House, the Taj Mahal, Angkor Wat, and the Vatican, are cardinally oriented. Their architects oriented them to our current cardinal system, and that means to our existing geographic pole.
When we process the orientations of virtually all ancient buildings around the world, it reveals a great discovery. Our research is so new, so innovating and refreshingly novel that you will not find anything like this anywhere else, except maybe some copies of this original material on other websites.
A Simple and Powerful Discovery
Shocked
Some people are shocked by the vast array of facts that supports our revolutionary model that is entirely mathematical. They deny that there is any evidence for this to be true and go on with their lives. However, who dares to deny established mathematical facts?

One giant ice cap once covered the Northern hemisphere. In this animation, we show two crustal spin positions of the Earth. The location of this ice cap was non-symmetric relative to our current pole position (left). The spin axis was on Greenland during the ice ages (right). The two eccentric red circles in the right animation indicate the amount of shift the northern part of the crust endured over the last 300,000 years. This is the reason why this massive ice sheet was formed and disappeared again. The Greenland ice sheet will also melt due to this massive cataclysmic, but fully natural process.
The facts of our new dating model are not only supported by our mathematical proof, but also by flood myths and stories of “Visitors from the Sky.” As if that is not enough our conclu
sion is furthermore supported by scientific observations such as the orientation of ancient sites, paleomagnetic data, orbital data of the Earth, and ice core data. All data is pointing in only one compelling direction. There is no escape; there is no place to hide from our conclusions.
Most people are even more shocked when they discover which time frames we have mathematically proven in our theory. While we have all been conditioned to think in terms of a few thousand years, here we are considering a time frame of human history of more than 350,000 years.
The pyramids of Giza belong to the youngest ancient structures on this planet. They are the crowning achievement of very advanced civilizations that once spanned the entire planet.
Simplicity is the Key – How the Method Works
Our method explores the orientation of pyramids and temples spread all around the world and combines them in a database. What we have discovered is that their orientation extensions result in one significant mathematical geodetic pattern. The resulting pattern appears to form several nodes. The probability that nodes of considerable size, resulting from the hundreds of intersecting orientation extensions, can occur randomly has been calculated and is close to zero for each intersection node.
Because the nodes occur in a latitudinal direction, they point to drastic climate changes, and we suggest that these are due to a series of crustal deformations. Remarkably, in every instance, we see that the distances between nodes correlate with the temperature peaks and valleys of the last series of ice ages. Moreover, of all possible places on our planet where these nodes could show up, they occur massively around Greenland. The odds for this concentrated nodal pattern to follow coincidentally the same sequence as the substantial temperature changes over the last series of ice ages is 1 to 256. We are talking about a time frame of 350,000 years.
However, when we examine these patterns more closely, we find an even rarer chance of 1 to 750,000 for the latitudinal pattern of nodes and temperature changes to fit coincidentally onto each other in this specific region. It appears to be improbable to be coincidental altogether.
To the contrary, it is not some statistical glitch but a very potent mathematical “signal” from more than 900 independent ancient structures around the world. We have discovered an ancient phenomenon that traditional science has completely overlooked, comparable to an encrypted message from outer space. It is time to wake up!
The Orientation of Ancient Structures is the Key to a Deeper Insight

Fig 2: Ancient pyramids are spread all over the world. Lost civilizations built all together thousands of them on every continent. The orientations of more than 900 ancient structures were mass-processed into a mathematical pattern. Our mathematical powerhouse revealed the unbelievable antiquity of Lost Civilizations and the truth of our long forgotten ancient past. This conclusion is consistent with excavation/depth patterns, i.e., when archaeologists dig up ancient remains from many meters of soil. The chronostratigraphy records tell that these layers are hundreds of thousands of years old. Geology and archaeology are separate disciplines both seemingly living in a fantasy world of their own. | © Mario Buildreps.
Mathematical Nodes Running Over Greenland
Of all possible places, why are these nodes running over Greenland, the large island which has a vast ice sheet of unknown origin? Moreover, if that is not enough, why do the distances between the nodes correlate with the glaciation graphs shown below? Could that all be just coincidence? It does not appear to be so. The probability that this is all the product of a random coincidental process is 0,000133%.
It is the most profound proof for the existence of former, ancient geographic poles, revealing the actual age of ancient structures. Our method delivers proof of corresponding latitudinal crustal displacements. The growing size of these clusters shows how the crust deformed in the past due to the displacements. The older the clusters, the larger is the extent of the deformations. Isn’t that logical?
Our theory also explains simple and elegantly why and how the vast, thick ice sheet on Greenland grew. Due to deformation cycles of the crust moved Greenland over the spin axis. Greenland’s ice sheet is now the last remnant of the vast glaciers that once covered North America, North Europe, and partially Northern Russia. Is it not obvious now that this ice sheet will melt, and why it will melt? Greenland’s location is at a latitude that is not sufficiently cold to make the ice sheet to grow further. It is not cold enough to sustain the vast ice sheet in the long term, i.e., it will melt very slowly.
Many Scientific Ideas Need to be Revised
It is now also easy to understand why CO2 lags on changing temperatures and why it cannot be held responsible for substantial climatic changes. We can now solve the many yet unsolved problems.
What many climate scientists never seem to have noticed is that Greenland is also the center point of the Laurentide ice sheet, the Innuition ice sheet, and the Scandinavian ice sheet.
As a climate scientist, to “create” an icecap on Greenland by playing with computer models with the assumption this island has never been on the geographic pole requires the strangest, most unscientific models you can imagine. Climate science has nothing to do with real science – it is a pseudoscience that mostly serves the agendas of politicians. Mainstream scientists do not dare to oppose this agenda and are afraid to lose their funding.
Our discovery questions a host of mainstream ideas regarding history, paleontology, archaeology, climatology, and geology. Mathematics, as the Queen of Science, does not care about ideas built on material “evidence.” Mathematics is the only immutable truth wherever we are, whatever we do, whatever we believe, and no matter how much mathematics is hated or feared. Mathematics can show us that most generally accepted ideas, from history to geology, are based on corrupted science, i.e., wrong belief systems.
Mathematical Signal That the North Pole Migrated in Relation to Ancient Structures

Fig 3: This simulation shows a correlation between ancient pyramids and temples spread all over the world. Billions of complex calculations revealed this point cloud that we have projected over a sphere. The clustering around Greenland is visible. Greenland was once on the North pole, and that is the reason it has an ice cap. That is also the reason why it is now melting. This powerful mathematical discovery or “signal” shows how deep this pure and profound theory goes, veritable light years beyond the current materialistic paradigm. 40.6% of the ancient sites appear to be related to ancient geographic poles. Their typical orientation patterns join together in an area of only 2% in such a way that they follow the rhythm of the ice ages. The odds for this pattern to be the product of coincidence is unimaginably small. | © Mario Buildreps.
Ice Ages Were Crustal Displacements
Our new holistic, entirely mathematical paradigm provides a working hypothesis dealing with Humanity’s ancient history in relation to the Earth. It does not leave a single doubt regarding the unbelievable truth of humanity’s antiquity, and finally, it explains virtually many of the ancient mysteries. Deluges were no myths; crustal deformations caused them. Science has found the ultimate evidence for these events in the ice cores of Antarctica, but it failed to interpret them correctly, and claimed that they were “ice ages.”
It is also crucial to realize that not all ancient buildings were oriented to an ancient geographical pole. We found that more than 37.3% of ancient buildings do not align with one of the nodes. Isn’t that entirely normal? After all, we do not live in a perfect world. Not all ancient architects oriented their structures to the cardinal directions, but the majority chose to do so, and thus they left an indelible and essential message for us.
We proved with our new dating method that the crust had crept exclusively in the latitudinal direction over extended periods when the Earth was in high eccentric orbit around the Sun. Antarctica, strangely enough, did not move and remained at a relatively stable position.
Why Only Eccentricity Correlates With Glaciation Cycles
The graph of Earth’s eccentric orbit around the Sun fits perfectly over the glaciation graph (Fig 12). Science still has no clue why this is so. The large rotational variations (and tidal oscillation) of the Earth during high eccentric orbits (as is the case with our Moon) generated a “vertical” reaction force. This force, when large enough, caused a large part of the crust to crawl and deform in the latitudinal direction over extended periods.
Our rationality has profound consequences on our grasp of ancient history. Humanity, as well as the ancient sites, are much more ancient than we ever imagined.
Ancient Buildings Working as a Compass
Imagine that someone decides to build a home on the heath, in the middle of nowhere. The new home is going to be square or rectangular. What will make this person decide the orientation of this house? The Cardinals? To the Rising Sun? To the ruling wind directions? The local geography? Alternatively, something else maybe? What could this “something else” possibly be?
That is maybe not entirely relevant for an ordinary home but how would an architect orient an astronomical observatory? That is when such a question would become relevant. Most observatories’ orientations are to the cardinal directions. It is easy to understand why. How else could one “rule” the sky?
If we look at how many cities in the US are oriented built from scratch in the middle of nowhere, we see they are most of the time cardinally oriented. Any other orientation is a sort of gamble game. An almost chaotic process of stowing buildings as effectively as possible in the remaining space.
Many architects will align their project according to the Cardinals when they have enough space to do so – and some do not. There are as many reasons as there are architects, ranging from spatial planning to natural environmental factors like mountains or rivers. That is how this simple (although mathematically complex) method works – it can reveal some deeply hidden aspects of very ancient civilizations.
We Proved That Homo sapiens Build During Their Entire Presence
Most people believe that no advanced structure-building humanoids existed when Earth was in the middle of a series of ice ages spanning the past hundreds of thousands of years. How do we know that is true? Because there is no “evidence”? We want proof, not vague signs of evidence.
Let us be clear about the nature of evidence. Have we ever seen evidence that was not overthrown by other, newer pieces of evidence? When dimensions and measurements such as kilos, Newtons, meters, seconds, Joules, and so on are involved in the primary evidence, it is likely that this will be overthrown one day by other “standards” serving as evidence.
Homo sapiens is present on this planet for more than 400,000 years and has been a gifted builder directly from the start. It is the species that decides its capacities and not the conditioning institutes that we call “educational training”.
Orientation is Dimensionless
What is orientation? It is dimensionless, hence purely mathematical, and not materialistic. For example, 90° = ½π and 180° = π, and so on. With the location it is likewise; namely, we have degrees or Pi solely – and this means that there are no materialistic units attached to it. By defining ancient buildings like this, the ancient builders show us a way to an ultimate and undiscovered truth: our real history.
Once you have entirely grasped this concept, a whole new world will unfold to you!
We have found that ancient buildings, like pyramids and temples, frequently have orientations that relate to cardinal points (like a compass), mainly because we processed them in large numbers. The patterns are overwhelming, and they instantaneously prove the correlation between ancient structures and glaciation cycles. We have concluded that Glaciation cycles are caused by latitudinal crustal shifts, thereby resulting in “ice ages.”
Examples of Orientations

Fig 4: A square or rectangular building like a pyramid has four sides. We can define the orientation of such a structure uniquely, so as not to discriminate one flank over another. The only unambiguous way is 45 degrees clockwise or 45 degrees counterclockwise. As you will see, orientation reveals a mighty mathematical way to describe the relationship of ancient structures concerning Earth’s shifting crust and the rise and fall of glaciation cycles, and ultimately of long-forgotten civilizations. | © Mario Buildreps.
Why Satellite Footage is Preferred Over Field Work

Fig 5: The intersection points of the orientation of these two structures, both facing North (cardinally oriented), is on the current geographic North pole. They belong to the same contemporary time frame. We have performed massive data research to more than 900 of these ancient monuments and what we have found has stunned even the most seasoned skeptics. | © Mario Buildreps.
We are now able to prove the age of pyramids and other such structures solely by their orientation, without digging into the ground or putting even one step on a monument. That is the difference between materialistic sensory-based science and mathematics.
How is this research done? By mass-processing the orientation and location of ancient buildings, we were able to determine the rough time frames in which specific structures are built. The correlation between orientation and age has profound importance, as you will see.
In this area of research, one decade of satellite footage has been more constructive than centuries of digging. Although it might be necessary for other scientific disciplines to dig up the foundations from under thick layers of soil, for our purposes, examining satellite footage is better than mindless digging.
Why We Need an Intersection Line
When we want to find the geodetic intersection point of the orientation of two randomly-picked structures that are non-cardinally oriented, there is a significant chance that this intersection point will not reveal anything meaningful. That is because their intersection point can be located anywhere on the globe. Such an endeavor is probably not likely to result in anything fruitful.
For example, it is easy to verify that the intersection points of the pyramids of Giza and the tomb of Ping of Han in China intersect each other on the current geographical North pole (fig. 5). We know what this means; they were intended to be oriented in this way. But what about the 85% of non-cardinally oriented structures?
Can we do the same with two structures that are oriented with a seemingly arbitrary angle? For example: can we do that with Teotihuacan and the Great Ziggurat of Ur? The intersection points of these two are 35.050N, 93.675W. What could we possibly find here? Nothing of importance as far as we can tell because there is no way even to suspect that connecting these two different structures via their intersecting lines could have something in common. Or perhaps, more importantly, we have no idea why they were “uncardinally” oriented in the first place. No archaeologist can tell you why Teotihuacan or the Great Ziggurat of Ur are oriented in their unique way.
Intersecting lines are neutral, so to speak – they represent a purely mathematical entity and have no meaning until they are correlated to each other by processing many hundreds of additional intersecting lines from other structures and then tabulating the resulting data.
How the Intersection Line is Determined

Fig 6: This picture shows in one view how the intersection line runs from pole to pole along a rough reference line of 47.1W. The intersection point from the two different hemispheres is at 73.2N, 47.1W. Because we now have two points, we can draw a connecting line. This line runs from the current North pole through the location of a previous pole. The point cloud of Fig 3 played an important role to verify this outcome. | © Mario Buildreps.
Why the North Pole Migrated Latitudinally
Some people wonder how the North pole could have migrated so seemingly perfect in the latitudinal direction along the reference line of 47.1W. It did not shift immitigable along this line. It moved in an irregular pattern along a rough latitudinal path in hundreds of thousands of years. The crust deformed in this typical way because it obeys Newton’s 2nd Law of Motion, exemplified by a spinning top reacting perpendicularly (at right angles) to its causative force. The cause is the Sun’s oscillating “pull” during high eccentric orbits. That is why the glaciation patterns and eccentricity (part of Milankovitch’s cycles) correlate perfectly with each other.
As stated, the crust did not shift equally. It was heavily deformed while Antarctica hardly moved. During this complicated deformation of earth’s skin, the North pole migrated in the latitudinal direction.
Shown below in Fig 14, you will find illustrations indicating the Poles I to VI with red dots. The size of the red dot grows with the age of each pole. The path of the pole is defined by the dimensions of the red dots, so that is not entirely a straight line, but roughly in the latitudinal direction.
The reasons for the red dots to become larger is because of the growing uncertainties of defining a pole within a specific diameter, i.e., the crust was invariably deformed due to the crustal displacements.
Orientations on Both Hemispheres are Fundamentally Different

Fig 7: This unique graph shows how ancient structures are oriented on the Western Hemisphere. They are massively positively oriented, i.e. pointing in a direction that is greater than 0 degrees (current North). There is no correlation between latitude and orientation, hence we debunk the possible claim that they were “solstice”-oriented buildings. The yellow marks show the relation between solstices and latitudes. There is no correlation between contemporary solstices and orientation. The amount of ancient buildings that are positively oriented is about 16 times as high as those that are negatively oriented. The odds for this uneven distribution to be coincidental is zero or 1 to ∞. That is why we are 100% sure that this orientation depends on something that has never been discovered before – a moving geographic pole from the perspective of the crust (a moving magnetic pole leaves a completely different signature). | © Mario Buildreps.

Fig 8: This graph shows how ancient buildings on the Eastern hemisphere are oriented. They are massively negatively oriented, i.e. pointing in a direction that is less than 360 degrees of the current North. The larger spread is caused by the much larger area (from Europe to China) in which we find the ancient buildings. The amount of ancient buildings which are negatively oriented is more than three times as high as those that are positively oriented. The odds for this uneven distribution to be the process of coincidence is close to 0%. The yellow dots mark the solstice angles for each latitude. There is also here no correlation between solstices and orientation. | © Mario Buildreps.
Instantaneous Proof: No Probability of Such a Spread being Coincidental
The probability that many structures, randomly spread around the world, are oriented like this is so small that it surely is not coincidental. That is why we are 100% sure that ancient monuments were oriented to one feature that is common wherever we are on Earth: a geographic pole. That is NOT the magnetic pole, it is the spin axis of the earth. But the position of this geographic pole has changed over time. The crust appears to “rewrap” itself during high eccentric orbits, causing the geographic North pole to migrate as seen from the perspective of the crust.
The only correct conclusion is that the crust has been deformed significantly over the last 400,000 years, without geology even noticing this fact. They measured it, yes, but did not interpret it as a movement of the crust. They explained it as “glaciation cycles.” Logical maybe, when you believe the crust was rigid over the last hundreds of thousands of years.
Strangely, geologists believe in the movement of the “invisible” magnetic field. It seems more convenient to think that an invisible mass that is much greater than the crust can change directions as sudden as the weather. But it is ironic that even paleomagnetism points to movements of the crust. Until now, this discipline has been attempting to repair errors and contradictions in the conventional data but without much progress. However, when we incorporate the movements of the crust in their data, the errors suddenly become much smaller, and that adds to the mountain of proof we already have.
We have proof from different angles, and all of them are pointing to the same unbelievable truth. Not only were the biblical cataclysms very real, but it is also indisputable that in the distant past the ancient architects oriented their structures to a very different geographical pole. Our proof goes many ways – deep down into the rabbit hole.
The Origin of Homo sapiens
We are also sure that structure building humanoids, the Homo predecessor, came originally from South America, from the region of Brazil and Peru, around 800,000 years ago, and then spread Northward. We have concluded this from the orientation patterns.
We studied the orientation patterns in relation to crustal shift patterns and the most probable migration routes our ancestors took. The trends go North through Mexico, spreads over the US, and then go over a land bridge across the Bering Strait into Russia, Japan, China, and the Middle East. Land bridges were everywhere across the world at that time when the ice sheets were developing on the Northern hemisphere, causing the sea levels to be significantly lower than today.
The orientation patterns we have found in the region of Iraq, Iran, and Syria correlate with the periods mentioned in the Sumerian tablets, around 420,000 years ago. The details of what exactly happened are of course impossible to reconstruct, but indicators are pointing to a significant event in the “mutation” of Humanoid species.
Homo sapiens’ Family Tree

Fig 9: DNA patterns of the Homo erectus family tree show correlations with orientation patterns. The “Out of Africa” hypothesis is short-sighted and based on incomplete and outdated evidence. Why did the Neanderthals, a tough, highly intelligent, and well-adapted species, become extinct? Ask yourself this simple question: If Göbleke Tepe is only 12,000 years old and is allegedly the oldest human-made monument on Earth, what were Homo sapiens then doing the rest of the time? Was Homo sapiens wandering around for over 400,000 years doing nothing and leaving no traces of significance? We have found compelling proof that Homo sapiens was very active over the last 450,000 years. There is something very wrong with the dating methods of the established academia. What would be the purpose of maintaining and teaching a false paradigm? source: Nature.com | © Mario Buildreps.
Collective Orientation of Contemporary Buildings
Maybe you suspect that, if we do the same kind of research regarding the orientation of contemporary buildings, we could, for some odd reason, find a collective orientation that differs from North similar to the ancient buildings. But that does not appear to be the case. The joint orientation of contemporary buildings points almost precisely towards our current geographic pole, our current cardinal system.
The more data one gathers – whether in a particular region, one country, one continent, or the whole world – the more obvious it becomes that contemporary buildings have an average collective orientation toward the geographical pole. No modern culture seems to prefer a specific direction other than a cardinal orientation.
This large-scale investigation is part of our challenge to prove that ancient buildings differ largely in orientation and that this deviation has a reason: the geographic pole was at another location back then, a very long time ago. Our mathematical model completely contradicts what contemporary history books are telling us. History is about storytelling and has nothing to do with reality.
We built a random location generator for every continent and generated a list of 392 contemporary buildings with their location and their respective orientation. When we compiled their collective orientation, they all pointed to our current geo pole within ±0.5°. This result proves that, when we add up the orientation of large numbers of independent buildings, they will always point to their geographic pole.

Fig 10: The collective of the orientations of 392 contemporary buildings points almost exactly to our current geographic pole. The significant deviation alone between modern buildings and ancient buildings proves mathematically that old buildings were oriented to another geographical pole location. Never before, has anyone ever done this kind of research, in this manner and on this scale. | © Mario Buildreps.
What is the Time Frame for These Ancient Poles?
The interpretation of this whole new view on ancient times is that, when the crust shifts (along with its pole) in the latitudinal direction, it causes a new glaciation cycle.
Most researchers, even the most controversial ones, keep sticking to a time frame of a few thousand years. They have never dared to even think in terms of hundreds of thousands of years. That is why the many ancient structures, as well as all the old myths, remain shrouded in mystery.
Our new dating method sheds an entirely different light on our history and provides an opportunity to explain most of the mysteries that no one has ever solved before. There are just too many dating mysteries around the world that scholars like to compress into less than 10,000 years, which is, according to our intense research, completely irrational. The amount of labor necessary to build all these tens of thousands of structures in a few thousand years was not present. That is another indicator that the official timelines are incorrect.
We consider a time frame of over 400,000 years without a shadow of a doubt. Our conclusions are fully backed up by large amounts of data and mathematics.
Consider the Mysteries and Start to Wonder
Which mysteries are we talking about here? You would have to continuously juggle a long, long list of mysterious sites in your mind to realize the sheer magnitude of our ancient past, such as:
- Why do we find hundreds of pyramids all around the planet?
- Why do we find thousands of dolmens all around the planet?
- What about Puma Punku, Sacsayhuaman, Teotihuacan, Göbekli Tepe? There are thousands of these ancient monuments, all over the world.
- What about the Nazca lines?
- Have we ever unanimously solved how the pyramids of Giza were built, not to talk about when and why? And if you think that you have answered one of these enigmas, stop cheering, because you have only solved a tiny fraction of the whole mystery.
- Have you ever heard of the mysterious Kailasa temple? If you have solved Giza, try to explain this one.
- What about Baalbek, Mount Shoria (Russia), Stonehenge, Carnac, Easter Island, and Yonaguni?
- How did they produce, move, and position megaliths weighing some 1000 metric tons? With the power of the mind, or with brute technology? If either of them is true, how?
- What about the underground city of Derinkuyu in Turkey? How and why was that built?
And that list is just one grain of sand in a whole mountain of sand. Keep that in mind!
To prove the correct timeline of any one of these mysteries requires more than only educated guesses and vague hypotheses. To even begin to solve these ancient enigmas requires more than hopping from one idea to the next. It requires a deep understanding of mathematics and immutable truths. With our new dating method, we have developed sufficient mathematical proof to support the claim for our enormously stretched timeline.
Why Ice Ages Were Latitudinal Crustal Deformations

Fig 11: When the crust shifted in the latitudinal direction, you will invariably find large temperature swings in the ice core data, and when the data correlates, the data matches because of a latitudinal crust shift and not a temperature change. One of the aspects of this discovery is that Antarctica remained at a fairly stable position over the last million years while the rest of the crust was heavily deformed. | Public Domain
The Mayan, Aztec, and Inca Cultures Are Much Older
The Mayan, Aztec, and Inca cultures are much older than scholars always told us. Why did these cultures suddenly disappear? Scholars have never found a credible explanation for the rapid disappearance of these highly developed cultures, except mythos tales, opinions, and just ideas.
For example: When scholars claim that a specific civilization abandoned a city in the 9th century AD, they are talking about the people who used the cities, not about the people who built the cities. There is quite a difference.
Because they oriented their monuments to a different older North pole, the cultures who built them must also have experienced destructive crustal shifts, throwing them back into the “stone age.” It would be challenging to survive such a catastrophe.
It appears that especially these Mayan, Aztec, and Inca root cultures are amazingly older than was always assumed. According to our research, the oldest traces go back to over 700,000 years! These cultures are the root of human civilization as we know it. The Out-of-Africa theory appears to be highly incorrect.
How the Rough Data Corresponds to the Intersection Clusters

Fig 12: The intersection clusters that we found at the beginning of 2016 showed a very tight correspondence with the temperature swings of the last glaciation cycles. The degree of temperature change corresponds one on one with the amount of shift from XS to XL. The odds for these patterns to fit coincidentally is only 1 to 3,125 (note: that includes the yet unproven Pole VI). It is not difficult to see that very high eccentricity caused two consecutive shifts (B and C). It is easy to see how well eccentricity (part of Milankovitch’s cycles) and ice ages correlate with each other. There is only 0.03% chance that this correlation is unimportant. Note that science has never done anything with this simple, obvious observation. Our search for much more data on ancient structures has progressed a long way since 2016. | © Mario Buildreps.
How to Interpret Glaciations
The temperatures on Earth depend on the latitude where you are. It is crucial to understand that you can interpret a glacial period in two ways:
- The classical view : During a glaciation, the geo pole was where it currently is, so the crust endured no shifts or deformations, but the temperature changed nevertheless. Which mechanism caused this glaciation is still unexplained. Geologists who believe that the Milankovitch cycles were the cause of the ice ages are parroting unexamined beliefs. We have never seen any calculations that prove this assumption even to be correct. Earth is a sphere, and will always receive the same amount of solar energy, no matter how the sphere rotates towards the Sun. The climate will show ripples of about ±1.4°C, but these changes are caused by varying Solar activity.
- Our new view : Crustal deformation causes a glaciation cycle. Collected ice core data shows that the amount of crustal shift corresponds to the temperature change of the glaciation cycle. The crustal shift moved the cold North pole region to a warmer area and a more temperate zone to the polar region. When geologists examine the phenomenon with the assumption that the crust is rigid, they interpret their findings as a global cooling down, which never happened. The temperatures return to “normal” after a period of tens of thousands of years. A balance is again restored. This crustal “crawling” process was caused by a highly eccentric orbit of the Earth around the Sun, resulting in oscillating gravity tearing the crust slowly apart. That is why the patterns of eccentricity and glaciation match together. Crustal deformations proceed very slowly – between 15 to 35 meters average per year, depending on the rate of eccentricity. The crawling process continues over periods spanning tens of thousands of years but has a definite start and stop values. Paleomagnetic records show correlations with the crawling crust. Other evidence is indisputable: high dust concentrations in the atmosphere during the crawling process due to very heavy volcano eruptions. The geological patterns are distinct, and the mathematical proof from the orientations of ancient sites removes all doubts. Humanity fell back into a new Stone Age for a very long time.
When the crust deforms, and the North pole migrates, the temperature changes in that specific “ice age” clearly correspond with the temperature differences at the latitudes of pole locations in different time frames.
The Impact of this new Dating Method
Our methodology permits the dating of ancient cultures (pyramid builders of yore) in a more reliable manner, via the orientations of their monuments, which in turn is related to a glaciation cycle. Every glaciation cycle stands for an era. However, some structures do not match up with one of the former poles. Dating these structures requires a thorough investigation by using the path of the pole since it is possible these structures date from periods of crustal unrest. Many structures have been dated by us, as you can see summarized below.
Geologists say that every ice age is a period of an alleged cooling down. “Alleged” because the classical view dictates that the crust is rigid and cannot deform significantly over, geologically speaking, short periods. Polar ice sheets that shifted to warmer regions will cool that region, and the ice sheets will start to melt very slowly. Melting takes place throughout many thousands of years. The more moderate region that shifted to the pole now becomes cold as well. The melting energy must be provided by the two Gulf Streams that transport the heat from the equator to the icecaps (following the 2nd Law of Thermodynamics). That is why there is a warm Gulf Stream and a North Atlantic Drift running close to Greenland; they are necessary to restore energy balance.
True to the tenets of Occam’s Razor, our new methodology provides an easy-to-understand explanation for glaciation, ancient history, and crustal geology – in the simplest possible way and with the fewest assumptions.
Gathered and Analyzed Data
| Topic | Amount |
|---|---|
| Ancient Pyramids, Temples, Sites, Constructions and other monuments | 900+ |
| Countries | 53 |
| Found Orientation Clusters (Polar Nodes) | 5 |
Results of the Data Analyses – All in One Graph

Fig 13: The analysis of our full data set delivered spectacular results. The probability percentages are almost 100%. We can also see, that the latitudes/temperature variations correspond closely with the large fluctuations of the glaciation cycles over the last 450,000 years. The odds for the distributions of Orientation Clusters to fit so seamlessly on the glaciation graphs (Fig 12) is 1 to 750,000. | © Mario Buildreps.

Fig 14: Four former poles are mathematically proven, but the oldest known former pole (Pole VI at around 42N) needs more confirmation. This oldest and yet unproven pole is mainly substantiated by Sumerian and Peruvian sites. The amounts of shift A through E correlate with the temperature changes of the last series of ice ages. | © Mario Buildreps.
Why did the Crust Shift in this Direction?
The most probable path of the pole is in the southerly latitudinal direction. It follows the basic principles of physics and is like the reaction of a spinning top on an external force; it reacts at 90 degrees to the direction of its rotation, and that is why the crust shifted as we propose in our hypothesis.
The dynamics, in this case, are the large tidal forces when Earth is in a high eccentric helical orbit around the Sun. The interconnectedness is further explained in our article: ” Lost Civilizations and Earth Crust Shifts. ”
As we show in Fig 12, follow the highs and lows precisely the same rhythm as the distances between the Poles I to V. The probability that two independent relatively simple patterns match is quite small: 1 to 256. The likelihood that we look at a coincidental match is less than 0.4%.
But if we incorporate the natural temperature variations due to different sun activity (Fig 16), we see that the patterns match even more accurately. And for these much more complex patterns to match coincidentally is very small: 1 to 750,000. Thus we have found the most probable cause for ice ages. These were not precipitated by changes in CO2 levels but by crustal deformation cycles. CO2 is just a proxy that lags on the crustal deformation cycles.
Five Geographic Poles: Mathematically Proven

Fig 15: There is an overwhelming correlation between the orientation of ancient structures and the waxing and waning of glaciation cycles over the last half million years. The probability that the correlation is unimportant and coincidental is 0.00013%. Some of the current scientific paradigms, such as the cause of ice ages, the Global Warming dogmas, but also the dating methods of ancient structures, are based on incorrect evidence. Ancient cultures oriented their pyramids and temples to other geographic poles. Our astounding and significant discovery is that Homo sapiens’ architectural history goes back more than 350,000 years. There is no place to hide from or cover up our conclusions. | © Mario Buildreps.
The Time Frame & Shortlist of Ancient Structures
| Pole | Pyramids, Sites, Temples |
|---|---|
| I: 0 – 26,000 years ago | Borobudur, Konark Sun Temple, Temple of Horus, Pyramids of Giza, Tomb of Emperor Ping of Han |
| 26,000 – 130,000 | Period of crustal deformation: Pole II to Pole I |
| II: 130,000 – 155,000 years ago | Babylon, Prasat Phum Prasat, Uxmal (Pyramid of the magician), El Mirador, Ka’ba-ye Zartosht |
| 155,000 – 210,000 | Period of crustal deformation: Pole III to Pole II |
| III: 210,000 – 225,000 years ago | Teotihuacan, Pompeii (temples), Carnac, Edzna, Tomb of Emperor Zhao of Han, Antipatris |
| 225,000 – 240,000 | Period of crustal deformation: Pole IV to Pole III |
| IV: 240,000 – 270,000 years ago | Yagul, Kuara (Sumer), Great Kyz Kala, El Castillo (Chichen Itza), Pyramid of Koh-Ker |
| 270,000 – 330,000 | Period of crustal deformation: Pole V to Pole IV |
| V: 330,000 – 345,000 years ago | Tomb of Three Kings of Zhou, Der (Sumer), Nohoch Mul pyramid (Cobá), Caral, Madinet Habu temple, Borsippa (Sumer) |
| 345,000 – 410,000 | Period of crustal deformation: Pole VI to Pole V |
| VI: 410,000 – 440,000 years ago | Nineveh (Sumer), Sippar (Sumer), Eridu (Sumer), Pyramids of Cochasqui (No. 5, 9, 14), Huaca del Sol, Zabala (Sumer), Caral |
Why Ice Ages Were Earth Crust Deformations

Fig 16: This graph shows us with a very high degree of certainty which timeframe we are dealing with regarding crustal shifts. The natural temperature swings of Earth’s temperature (green areas) have to be filtered out to find the magnitude of the consecutive crustal shifts. Note that the amount of natural temperature variation varies by 2.8° Celsius (±1.4°). Varying Sun activity is the most likely cause of this discrepancy. The odds for this correlation to be coincidental is 1 to 750,000. Although there is still much research to be done, we have found profound mathematical proof for the most likely timeframe for the deformation processes of the crust. What we furthermore witness is that Pole III seems to be slightly incorrectly positioned. We suspect this because of the shift errors from IV to III and from III to II cancel each other almost out, and the chance for that to be just coincidence is small. But because our method depends strongly on ancient structures, we have currently no means to correct this. Of course, we could position Pole III slightly more Northerly at around 72.5°N or 72.6°N to compensate this glitch, but that would undermine our method. The cause of this relatively large deviation is possibly due to very large deformations of the crust particularly in the region of the majority of the structures. | © Mario Buildreps.
About the Average Temperature Gradient
Important to note is that the average temperature gradient of 0.576°C per degree latitude that you find in Fig 15 is calculated based on the surface area to which the specific temperature belongs. For example, at the poles, it is very cold, but the surface areas of the poles are tiny compared to that of the equator. Hence, the poles are not significantly contributing to the so-called ΔT, the temperature differences.
The reason why these temperature gradients are used this way in our research is that the temperature reconstructions from the ice cores use a similar method. Here we transform the data from the ice cores, and we recalculate them into a latitudinal deformation of the crust.
When we subtract the natural temperature variations, 2.8°C, from the most significant peaks and valleys in the ice age graphs, we find the remaining crustal deformations of the last significant events. In all cases, they are matching with temperature gradients between two adjacent subsequent poles. The chance for such a match to occur coincidentally in such a complicated set of patterns is 1 to 750,000. We are sure we have found the correct time frame.
The Crust is More Dynamic Than Often Believed
We have processed a large amount of data to calculate and prove the position of the former poles, and to calculate the reliability of this new theory.
It is crucial to realize that Antarctica hardly moved its position at the South pole, while Greenland raced over the North pole. When we look at the Pacific, we are looking at an almost uninterrupted plate that was stretched due to the deformations. That is the reason why there is no longer a continent in the Pacific. Australia was ripped off from Antarctica. Zealandia became submerged in the massive stretch movement.
When we look at the other side of the globe, it seems as if the opposite occurred. A massive compression took place from North to South, and a spreading from East to West. Hence a resulting movement of Greenland over the pole towards the equator. The timescale of these large deformations is much shorter than geologists ever realized. Yes, there are tectonic forces and the tectonic plates move towards each other or away from each other. But there is another force present that geologists have never recognized.
The Earth is much more dynamic than we ever thought. Our book (in progress) deals extensively with this subject because, although crucial, it is hard to grasp.
Our Data Shows how the Motion Mechanics of the Crust Works
The orientation of the foundations of ancient buildings, mainly because we processed them in large numbers, gave us profound insights into ancient times.
Ice age graphs correspond to the eccentricity of Earth’s orbit over the last 800,000 years. The chance for these two graphs to correspond to each other coincidentally is 0.00069% or 1 to 145,000. It shows that we must look at eccentricity for the root cause of ice ages and nowhere else. It is weird to notice that geology consequently overlooked this.
When we dive into the motion mechanics of large celestial objects, we see mainly two things happening:
- Eccentricity causes variations in the rate of rotation of the minor object (in this case the Earth). The inner parts of the Earth are much denser than the crust. Hence they will react less intensely to tidal forces of the Sun.
- Tidal forces vary annually (in case of Earth). The more significant the eccentricity, the larger the tidal variations. At perihelion, the Sun “pulls” hardest on Earth, almost egg-shaping the Earth. At aphelion, the Sun “pulls” less on the Earth. At an eccentricity of between 0.03 and 0.05, these annual forces can vary up to about 26%, putting the Earth’s different layers under varying amounts of stress.
From this we can quite easily understand what happens: a corresponding latitudinal reaction force is born. Compare it with a spinning top that reacts perpendicular to an external force applied to it. This reaction force drives the lightest and outer part of the Earth, the crust, to crawl perpendicularly to the sense of rotation during high eccentric orbital periods around the Sun.
The data indicate with a very high degree of certainty that former poles, namely former poles II, III, and IV existed on Greenland during the most recent ice ages. The crust has continued to deform not just slightly; it moved significantly. The North pole moved 38 degrees of latitude over the last 330,000 years (from pole IV to the present pole) — the crust ticks like a clock on eccentricity.
The Moving Crust Turns Everything Upside Down
The whole crust in the region of Greenland was heavily deformed – leaving Antarctica surprisingly stable at its current position – and Greenland moved over the geographic North pole between 330,000 and 110,000 years ago in two shifts, meaning that Greenland has three former geo pole locations. To illustrate: This is like three fence posts having two spaces between posts. The Greenland ice sheet is a result of this era, and that is why it is so densely covered with ice and is melting now.
Earth crust shifts do not happen overnight. They are slow, unstoppable processes that take place over extended periods. The most violent, swift crustal shifts took place throughout about 15,000 years, and the slowest ones happened throughout about 100,000 years. However, it is a period of constant turmoil, megaquakes, sloshing oceans, volcano eruptions, tsunamis, and a changing climate due to the shifting latitude and sliding earth crusts. Sea levels have changed repeatedly over many tens of thousands of years and will again fall or rise depending on the position of new geographic poles. Whether the pole is in the ocean or on land makes a world of difference in the formation of ice sheets.
An Earth crust shift is not the spectacular event that many people think it is. It is a massive, slow, environmentally disruptive, mighty deformation process of the crust, which forced many of the ancient peoples to migrate to safer places. It also caused massive extinctions of the Human population which we now call “lost civilizations.” The reasons for these massive changes have been right under our noses, and we collectively fail to recognize them.
The Probability that These Facts are True
The probability that temperature changes during the last ice ages accidentally correspond to our found mathematical hot spots is 1 to 746,496 or 0.000134%. It is therefore for more than 99.99987% sure that the following facts are real:
- The geographic North pole migrated in the latitudinal direction, while parts of the crust were massively deformed. Many traditions around the world describe these events as deluges and global catastrophes.
- Antarctica remained (almost) stable at its current position. Migration of the geographic North pole leaves proxy marks behind in the ice sheets of a stable and steady South pole. Both poles are equally sensitive to changes. That is the reason why the movements of the agile North pole are accurately registered in the ice layers of the stable South pole.
- The shifts of the North pole relate to “ice ages” in the exact order and magnitude as they are registered in the ice sheet of Antarctica.
- Ancient structures are oriented to these former geo North poles. The age of the ancient structures is in most cases as old as the pole.
- A high eccentric orbit around the Sun is the cause of crustal deformation in combination with expansion zones as we have described in this article ;
- Greenland’s ice sheet was formed by being repeatedly found at different successive North pole locations, and that its massive ice sheet will eventually melt because it has moved to a place of ‘moderate’ temperatures;
- CO2 lags on temperature changes and is therefore not the (primary) cause of temperature changes.
Antiquity Reborn – a Scientific Battlefield
Our new mathematical crustal displacement hypothesis will eventually prevail and change the way science looks at our history. It will take many decades to come to persuade them to accept the truth of what happened with the Earth’s crust. It will also have a profound impact on the current climate models once the method is validated and recognized by the mainstream “gate-keepers” as real and valid.
Of course, it will probably take many decades for this theory to mature. Much energy is being expended in the development of our theory, and we make rapid progress. Increasing numbers of knowledgeable scientists are surprised and amazed by our new dating theory – the genie is out of the bottle.
One example of the many profound implications this theory has: how much chance is there that paleomagnetism, which is a highly technical and well-funded discipline, develops a correct and valid theory anytime soon? Not very much – but why is that? Because mainstream Geology stubbornly ignores and dismisses the possibility of a slow latitudinal crawling crust during high eccentric orbits of the Earth around the Sun.
Crustal movements would also leave traces in the magnetizable sediments, and in fact, destroy the patterns that geologists hoped to obtain. That is why this discipline has never come to one overall acceptable view of the movements of the magnetic pole. There is no way to recognize from the samples alone what has moved: the core, the crust or both. Because of the magnetic core moves, it is therefore not the only variable that left traces.
Antiquity Reborn – Our Book
Our book, which is currently in the making under the working title “Antiquity Reborn,” will turn many generally accepted paradigms into dust; not by swinging words of accusation at anyone, but by using mathematics in a way most people will understand and accept as valid.
Aside from all the proof necessary to show what happened in the distant past, our book will provide a framework to develop a new look at lost civilizations, and what happened to them. It will also help us understand who we are and what our roots are. It will solve many mysteries and unite many scientific disciplines while probably raising many new questions at the same time.
© 2015 – 2020 by Mario Buildreps et al.
Proofreading and editing: J.B.
Contact: [email protected]
Antiquity Reborn
Mathematical Holistic Orientation-based Dating Method
Orientation of Pyramids to Former North Poles
There are many ancient monuments and sites oriented to the current geographic pole, and this is called cardinal alignment or cardinal orientation. But what does it mean when more than 90% of the ancient monuments like pyramids and temples are not oriented to the current geographical pole? What is it that archaeologists and geologists have categorically overlooked?

Fig. 1: There are many ancient temples and pyramids oriented to the current North pole. Of the more than 910 selected structures in our database, 90 are exactly oriented to the current North pole. How coincidental is that? | © Mario Buildreps.
[image]
Fig. 2: Tiwanaku (Kalasasaya) is cardinally oriented with ±0.2° accuracy. There’s much debate about Tiwanaku and who built it.
Why Are Temples and Pyramids Cardinally Oriented?
Around the world, there are many ancient structures, such as pyramids and temples, that are oriented in such a way that their footprint points precisely to the current North pole.
The ancients built many of their monuments in the middle of nowhere. What would you do if you had the freedom to position a monument anyhow and anywhere? Unless you have no idea what you are doing, there is only one logical answer to that question: You would orient it to the geographical pole.
It is also evident that there may be many other structures of importance that are oriented to the geographical North pole without an apparent reason. Pure symmetry between sunrise and sunset might have been one of these reasons. We happen to love the sun for many different reasons.
Our article(s) might be tough for many of our readers. But when you can work your way through it, you will probably become aware that our history, the way it was taught to us, is very much in error.
Earth crust shifts are real, and ancient monuments are much, much older than we are led to believe. By using mathematics, our real history reveals itself razor-sharp without any doubt whatsoever.
Why is Cardinal Orientation Important?
Fig. 3: A Cartesian coordinate system is used to orient and to place positions in a grid. A cardinal orientation of a building has similarities, it makes it easier to orient to the Cardinals and to a certain direction.
Imagine yourself to be in the shoes of an astronomer. There is a comet coming in on the Northern sky at an azimuth of 11 degrees. The building you are working in is just dumped down in the orientation of the street plan, and finding one of the cardinal directions is always somewhat of a guess.
If your building was cardinally oriented, it would be much easier to orient yourself. That window looks out on exactly North. This door opens exactly to the East. This wall is precisely South, and that large window looks out precisely to the West. How much easier would you orient yourself? How much easier would a discussion between astronomer be if they exactly knew in which direction to look for this comet?
You can compare the cardinal orientation of a building with a Cartesian coordinate system. The X-axis goes exactly horizontal, and the Y-axis goes precisely vertical. Drawing a graph is easy. Orienting yourself in this grid is easy. If the grid is rotated to the whims of the day, it would be challenging and inefficient to draw a graph. The first thing you had to do is to study the orientation of the grid itself before you could start to draw anything. It would be very inefficient to work like this.
So, when you want to study and predict solar cycles, moon cycles, solar eclipses, equinoxes, earth’s motions (obliquity, precession, eccentricity of orbit), or any other phenomena in the sky, you must point your instrument to the only sure point – the rotation axis of the earth. This would ultimately be the geographical North pole, or the South pole if you happen to live on the Southern hemisphere. If you do not do that, you will introduce another variable into the equations, and that makes them much harder to solve.
The same goes for churches. Most religions regard the East as the place where the light is coming from. The Rising Sun. That is the reason why many churches are cardinally or almost cardinally oriented.
The orientation of the Largest Cathedrals in the World

Fig. 4: The largest cathedrals in the world are, without exception, cardinally or almost cardinally oriented. | © Mario Buildreps
How Mathematics Proves Our History is Wrongly Interpreted
But what does it mean when most of the ancient monuments are not oriented to the Cardinals, i.e., to our current North pole? How likely is it then that they were oriented to former North poles? This can be sorted out by using the power of mathematics.
We proved that Greenland was the location of former (geographic) North poles. The structures that are oriented to these old geographic poles are therefore older than assumed by archaeologists.
Why?
Because these pyramids from all over the world were collectively oriented to several locations on Greenland. That Greenland was located at the North pole is not a few thousand years ago. We are talking about hundreds of thousands of years.
The foundations of most pyramids are older than 100,000 years. Their top layers might have been renovated many times – but the orientation was invariably left intact. An unbelievable conclusion that knocks down many paradigms. However, a lot of mysteries start to make sense.
Our claim is extraordinary; our proof is exceptional as well. The mathematics behind our proof is exceptionally accurate and will be published in a book that is currently in the making.
The orientation of Important Observatories in the World

Fig. 5: Most of the observatories are cardinally oriented and that has a good reason: Astronomers have to constantly orient themselves. A correct building orientation helps to make their task much easier. We know the ancients built many observatories around the world and only a few of these are cardinally oriented. Where were the non-cardinal oriented observatories then oriented to? Archaeologists have pondered this question for many centuries. | © Mario Buildreps

Fig. 6: Two boats sailing a steady course will intersect at a certain point. We can calculate this intersection point. When many sailing boats are intersecting at the same spot, would that be coincidence or circumstance? The same principle accounts for pyramid alignments. | © Mario Buildreps
Belief is Strong
Belief systems resist change. We invariably believe that history, as taught to us, is correct. Even when mathematics and other evidence proves that conditioning is wrong, we tend to keep thinking that history, as it is pounded into our brains, is correct.
This is what we call conditioning.
A conditioned mind has trouble to interpret outcomes of mathematics that deviate from the programmed beliefs. No matter how solid the proof is, we tend to fall back into our old assumptions of the trusty old paradigm. To get used to another idea and to muster the will to overcome denial takes much time and effort.
Temples and Pyramids Exactly Oriented to the Current North Pole (Fig 1)
- Lintong +12 other structures in China (pink line)
- Borobudur on Central Java (dark blue line)
- Angkor Wat +12 other structures in Cambodia (yellow line)
- Konark Sun Temple in India (orange line)
- Sri Rangam temple +1 other structure in India (red line)
- Harappa in Pakistan (green line)
- Bar’am +2 other structures in Israel (white line)
- Pyramids of Giza and Temple of Horus in Egypt (green line)
- Tiwanaku in Bolivia (purple line)
- Naranjo in Guatemala +3 other structures in Mexico (light blue line)
- Conimbriga (Portugal) and Lumbini (Nepal)
- Three pyramids in Mexico, Mayapan and Ek’ Balam
- and many other structures around the world
Total: 90 structures

Fig. 7: Borobudur is probably one of the most accurately oriented temples in the world – within ±0.1° accuracy aligned to the current North pole.
The question is: What is the probability that 90 of the randomly selected global 912 (ancient) structures are coincidentally oriented to the current geographic pole (within a range of 3 degrees)?
The probability is a whopping 1 to 6.15×10¹⁸, which is an incredibly small chance that this is the result of some coincidental process.
What does that mean? It means that the orientation of many structures to the geographic North pole is NOT coincidental. Hence, it was done intentionally. The reason? Why is the White House perfectly oriented to the Cardinals? Or why are the Taj Mahal and the pyramids of Giza perfectly cardinally oriented? Or why is the Vatican cardinally oriented? Or why are most observatories cardinally oriented?
The architects of these structures understood the importance of cardinal orientation.
We can be sure that the orientation of these 90 temples and pyramids was done on purpose, and therefore we can say with 100% certainty that the geographic pole is where the orientation of these pyramids and temples is based upon . It is crucial to grasp this part. We can extend the same methodology to the 90% other ancient structures which are not cardinally oriented and examine how they relate to each other. With our method, we are able to discern former geographic poles from the orientation patterns of these ancient structures.
Our powerful mathematical method delivers 100% proof of former geographic poles. Our history is not what it seems to be. The earth has four Lost Civilizations over the course of only 350,000 years. There were probably many more, but we cannot prove them with 100% certainty. The place where we found much older structures are around Peru, and around the Mediterranean.

Fig. 8: When two pyramids are pointing to true North, we can be certain that they belong to the same relative time period. Their northward extensions intersect at the spin axis. We now know that this period is our current crustal position. | © Mario Buildreps
Structures of Power Are Often Cardinally Oriented

Fig. 9: Many of the world’s most significant political buildings are cardinally oriented. Why? Ask the president? He probably doesn’t know how to provide the correct answer. Is a perfectly cardinally-oriented building the expression of a desire to dominate the masses or perhaps a world event? Hardly! | © Mario Buildreps
Do not Select Just Any Buildings

Fig. 10: Angkor Wat is oriented within 0.2 degrees to the current North pole.
When you want to prove a theory of this magnitude, it makes no sense to pick just any structures. No, the structures you must pick need to be monumental, big, ancient, imposing, and perhaps religious in nature. You would not want to pick some random buildings, such as the Notre Dame in Paris or another cathedral somewhere.
Did you know that the Vatican is almost perfectly East-West oriented, and therefore oriented to the current geographic pole? Whatever the reason was, it seemed important enough to orient it this way in the middle of a crowded metropolis. But the Vatican is not on our list – it is much too young.
Selecting just a random church in the middle of a town proves nothing. The location of the sun and stars did not matter for them, let alone the North pole. The church had to be placed in the spatial limitations of its surroundings at that time.
Our criteria for selecting ancient sites:
- undoubtedly ancient
- square or rectangular
- the larger the better (= of more importance)
- preferably isolated (= not influenced in orientation)
- orientation is measurable.
After years of hard work, we have been able to allocate more than 900 ancient sites spread around the world. Every ancient monument or site is carefully administrated with location data, orientations and calculations. The latest LIDAR scans in Guatemala have revealed massive ancient cities with pyramids and temples which are without exception oriented as we have predicted with our method. We have dated these cities with our method to be much older than archaeology have been telling us. In fact, they belong to one of the many Lost Civilizations .
Seemingly Criss-Cross Oriented

Fig. 11: Measuring the orientation of a pyramid is never 100% accurate. You must deal with a certain small error. | © Mario Buildreps
During our research, we found 4 other orientation clusters . An orientation cluster is an indication of a possible former geographic pole. To be certain about the validity of individual clusters, much more research was done to come to an ironclad conclusion. You might want to read the other articles on this website to get a full picture of the method we used.
Pyramids from all over the world are oriented to just a few locations that form data clusters on a so-called NORTH-SOUTH reference line. This line is explained further on in this article.
Some sites in Mexico comprise a large collection of pyramids that are criss-cross oriented as if they were just dumped somewhere. But the chance that a few structures on one site cross other alignment clusters are very, very small. It is almost zero. But if that occurs, it means it was not accidental. Some of the structures on the ancient site were reoriented to another pole.
These sites can be interpreted as sites that were rebuilt after a catastrophe – a crustal shift. These structures can tell us an interesting story of what might have happened in the past.
The Accuracy of Measurement
We know where the current geographical North pole is located. In Google Earth, we can measure the angle of orientation with which structures were built in relation to the geo pole. In this way, we can verify the accuracy of our measurements.
The first thing you need to know is how accurately a structure can be measured in Google Earth.
Take for example the Great Pyramid of Giza. We know it is almost perfectly aligned to the geo pole (within ±0.05°). So, we can base our methodology on this.
Experimental measurements on different parts of Giza showed that the average accuracy of measurement of Giza in Google Earth resulted in an error of ±0.20°. The pyramids of Giza are relatively easy to measure; the satellite footage is sharp and the bases of the pyramids are relatively clear.
Choosing the Error of Measurement
There are structures which are more difficult to measure accurately because of blurry satellite footage, or the angle under which the objects were photographed was not vertical (the baseline is the safest area to measure).
For some of these sites, archaeological maps with a North arrow indicator were used as a cross-reference to verify the outcomes of the measurement in Google Earth.
Experiments with measurements in Google Earth compared to maps of ancient sites showed a standard deviation of:
- σ=68.2%: ±0.5°
- 2σ=95.4%: ±1.1°
- 3σ=99.7%: ±1.5°
3σ (99.7%) was accepted as reliable enough for the calculations: ±1.5°. This also includes the error of measurement and glitches in the footage. Although Giza could be measured much more exactly, only ±1.5° (total angle is 1.5+1.5=3.0°) was accepted as the standard accuracy for the whole project, and that counted for Giza as well.
Accumulation of Errors

Fig. 12: Accumulation of errors can result in disasters.
When we intend to find former geographical poles, we must be aware of the possible accumulation of errors, such as:
- When the pyramid builders established the geo pole many thousands of years ago, they made a little error in their measurements. Even with our GPS systems today we must deal with a potential error of about ± 15 meters.
- When the pyramid builders constructed their pyramids, they again made a small error between their perception of true North and the actual orientation of the stones.
- When we measure the pyramid many thousands of years later, the position of the pyramid might have changed a little bit, due to geological processes, especially when earth crust displacements appeared to be at work.
- When we measure the pyramid many thousands of years later, we again make small errors in our measurements.
It is possible that all these errors cancel each other out and nicely turn out to be perfect, but it is most likely that we will find an erratic pattern of ‘noise’. This noise is the accumulation of the above-mentioned errors, and is ultimately the root of the sum of squares: the combined error Δn = √(x12+x22+x32+x42 …+…xn2).
Cardinal Versus Non-Cardinal Orientations
Fig. 13: When we measure more than 910 ancient objects chosen from all over the world, we will find a stunning result: Mathematical proof that the earth’s crust has shifted following the rhythm of Earth’s eccentric orbit. | © Mario Buildreps.
Probability That Giza Was Meant to Point North
The chance that one of the pyramids of Giza is oriented cardinally by coincidence is 1 to 30 (90÷3.0).

Fig. 14: When alignments are measured under a large angle, the error will remain small. | © Mario Buildreps
The chance that all three of them are coincidentally oriented to the North pole is almost ZERO. To be exact: 0,0037% ((3.0/90)3 × 100%). Therefore, Giza’s orientation was certainly no coincidence.
The claim that all three were meant to be oriented to the current geographic pole is 99.9963% sure.
How to Define the Chances of Intentional Orientations
Most pyramids have four sides. Since we do not know for certain the purpose of a pyramid, we cannot discriminate one side over another. So, the angle in which it can be uniquely arranged is 90° (360°÷4). We cannot tell which orientation regarding the geographic pole has a higher priority, so we can only define structures 45 degrees left of the geo pole and 45 degrees to the right of the geo pole. This is the mathematical unambiguous basis for our method.

Fig. 15: Measuring objects that are aligned under a small angle results in a larger error. | © Mario Buildreps
With the average accuracy of ±1.5° with which we could measure our chosen structures, there are certain discriminating steps within the angle of 90° 30 which creates a standard chance of 3.33% in the defined methodology that a pyramid is accidentally pointing to the North pole.
There are currently 912 measured structures in our database. Hence, it follows that we can count on a standard chance that 30.4 of these structures (912×3.33%) are pointing North. Thus, when we find 30 structures clustering within an area of 3 degrees along the intersection line we cannot claim a special status based on that. But when this number of random clustering approaches 40, 50 or even 60, the probability of coincidence rapidly diminishes towards ZERO. We can distill from these combined patterns the conclusive proof that the crust, ultimately the North pole, has shifted and that pyramids are much older.
Why much older? Because such a devastating and catastrophic event would not have happened completely unnoticed over the last several millennia.
Of the randomly selected structures, there were 90 ancient structures in the database pointing to the current geographical North pole. As we have already shown above, the chance for this to be mere luck is ZERO.
When another cluster of this magnitude shows up, it is surely one of the former North poles, with a certainty of almost 100%. Let us have a look.
[image]
Fig. 16: How large is the chance that almost 50% of all the alignments are running over Greenland, which is just 24% of a quarter hemisphere? When we are trying to find another pole, Greenland is our best bet. | © Mario Buildreps
Finding the Other Poles
We can find former geo poles by following the orientation patterns of ancient structures and by calculating the probability that it is a former geo pole location. We follow the patterns of pyramid orientations which are not pointing to the current geo poles.
But since we only know the current geo poles for sure, and we are uncertain where to look, it is best to go from coarse to fine. If there are hints that the former geographic North pole might have been on Greenland, the first thing that could be done is to look for the number of orientations that intersect on Greenland as a whole.
The number of (ancient structural orientations) intersections on Greenland is 410 of the total of 912. The probability for such a large amount of data to cluster in such a way is ridiculously small: 1 to 4,16×1038[1]. We can be very confident that a former geo North pole was somewhere on Greenland. Or better, Greenland was once situated on a former geographical North pole.
We can claim this with 100% certainty, even if we do not know anything about geology, archaeology, or some other scientific discipline. We do not have to drill holes and do all sorts of fanciful looking expensive research. We do not need to fly with helicopters over glaciers, or other useless sorts of research. We only need mathematics to find the highest potential of truth.
We do not know yet where to look at Greenland. That can be done by following simple logic. How? By connecting the pyramids by using an ‘independent intermediator’ – an intersection line. This line represents the rough path the pole took over the last 400,000 years.
[1]: n=912; x=410; p=0.24; q=0.76
Creating an Intersection Line Over Greenland

Fig. 17: When we draw a vertical line towards the South pole at a longitude of 47.1 degrees, which is over the middle of Greenland, we can analyze how many ancient alignments intersect that line. The peaks in the graph show the most likely locations of the former poles. This line has been established by using our massive database. | © Mario Buildreps
Why Not Connect Pyramids Directly?
It happens often, especially on the internet, that people claim to have found a connection between ancient objects by drawing some lines between them. In most cases that means absolutely nothing, and we cannot draw any conclusions from that.
With 912 pyramids we can have ½×(9122-912) potential unique connections. There is however not always a connection point formed between two structures, simply because there is no mathematical solution. With 415,416 potential intersection points, it would be an immensely unreadable scatter plot with over 90% of useless noise in it. We have nevertheless done all these researches, which you can find on our website. Our research is vast and deep, and we are still extending our research because we have found the ultimate key to so many questions.
We can find an intersection point between two of the most enigmatic pyramids on the planet, Teotihuacan, and Giza. They intersect near Kongsfjord located in Northern Norway. We will find nothing useful at that location. Perhaps even more importantly, we would not know why these pyramids and temples were “un-cardinally” oriented, to begin with.
The intersection lines of ancient structural orientations will lead to clusters of pyramids that we can safely group together leading to a definitive location of a former pole, a node of sorts. We can calculate the probability of such a node to form coincidentally. All the pyramids clustering around the same node belong to the same period .
Former Pole Locations

Fig. 18: The analysis of the full dataset of ancient structures delivered spectacular results. The percentages are almost 100% and they correspond to the latitudes vs temperature plots and thus correlate precisely with the last glaciation cycles. There is only 1 to 750,000 that such a sequence could occur coincidentally. We have found a very important clue to many questions. | © Mario Buildreps
How Probability is Determined
[image]
Fig. 19: the binomial formula for determining probability in complex situations
For example, on the reference line, we found 102 intersections between latitude 71 and 73. The standard probability is 30 intersections. We can calculate the likelihood that such a large cluster can be formed coincidentally by using the binomial formula.
- n = number of trials = 912
- p = probability of success = 0.03333 (3 degrees out of 90 degrees)
- x = number of successes = 102
P(x) = 1 to 5.91×1025
The probability that a data cluster of this magnitude is formed coincidentally is 0%. There is no team of scientists, no matter how large and how well funded, who can beat this number.
Conversely, we can say it is artificially constructed. Why? Because the probability it was intentional is ≈ 100%. All these randomly distributed ancient structures were clearly pointing to one location, namely to a former geographic North pole because the geographic pole is the only transcending geographical feature wherever you are on the globe. But since this geo pole appears to migrate, we find a migrating orientation pattern of ancient structures.
The same situation was emulated by using Monte Carlo simulations, which gave the same results. We can be sure this method expresses this situation correctly. This knowledge has great consequences.
Intersection Clusters = Proximity of Former Geo North Poles
| Latitude | Intersections with 47.1W Lon line | Probability Former Geo pole |
|---|---|---|
| 76.0°N | 90 | 100% |
| 72.2°N | 102 | 100% |
| 64.1°N | 94 | 99.9999998% |
| 52.2°N | 83 | 99.9997812% |
Mathematical Clustering Over Greenland
Fig. 20: The clustering over Greenland is formed by more than 34,000 intersection points and delivers instantaneous proof of an unbelievable reality: Four former geographic poles. The distances between the nodes correspond very intimately with the temperature changes of the last series of ice ages, revealing the period of existence for these poles. | © Mario Buildreps
Intersection Clusters on Greenland
Another item becomes clear when we look deeper into this issue: The older the cluster, the larger the area over which a dynamic group is formed. It might sound difficult, but it is easier than it seems. The older the geo pole to which certain pyramids were once oriented, the more deformations the crust had to endure. Plates were apparently deformed and thus also the accuracy of the oriented groups of related pyramids. They form a group over a larger area.
This mechanism shows itself in a larger spread of the oriented pyramid to this ancient geo pole. From this, we can approximately recalculate the amount of deformation of the tectonic plates due to the crustal shifts.
Crustal shifts enabled Greenland to migrate in several steps over the North pole. It is possible to correlate the magnitude of the steps with the temperature proxies δD or δ18O respectively found in ice cores of Vostok and Dome-C (Antarctica). The similarities are clear. From this, we can directly derive the time frames of the crustal shifts which are clearly related to the Milankovitch cycles.
The article on the main page tells the full essence of this theory and its exciting discovery.
© 2015 – 2020 by Mario Buildreps et al.
Proofreading and editing: J.B.
Regards

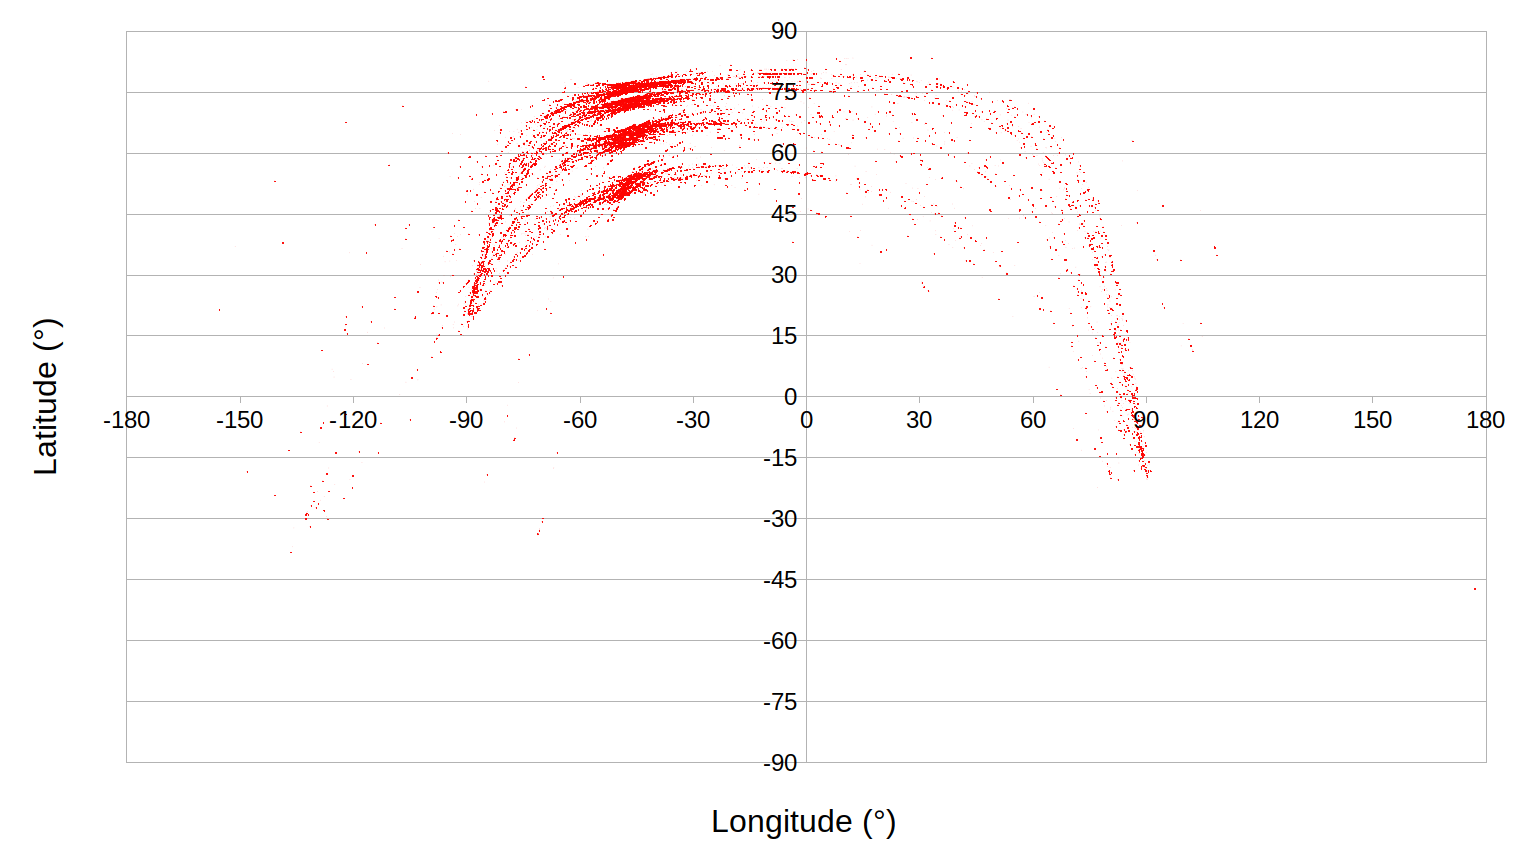
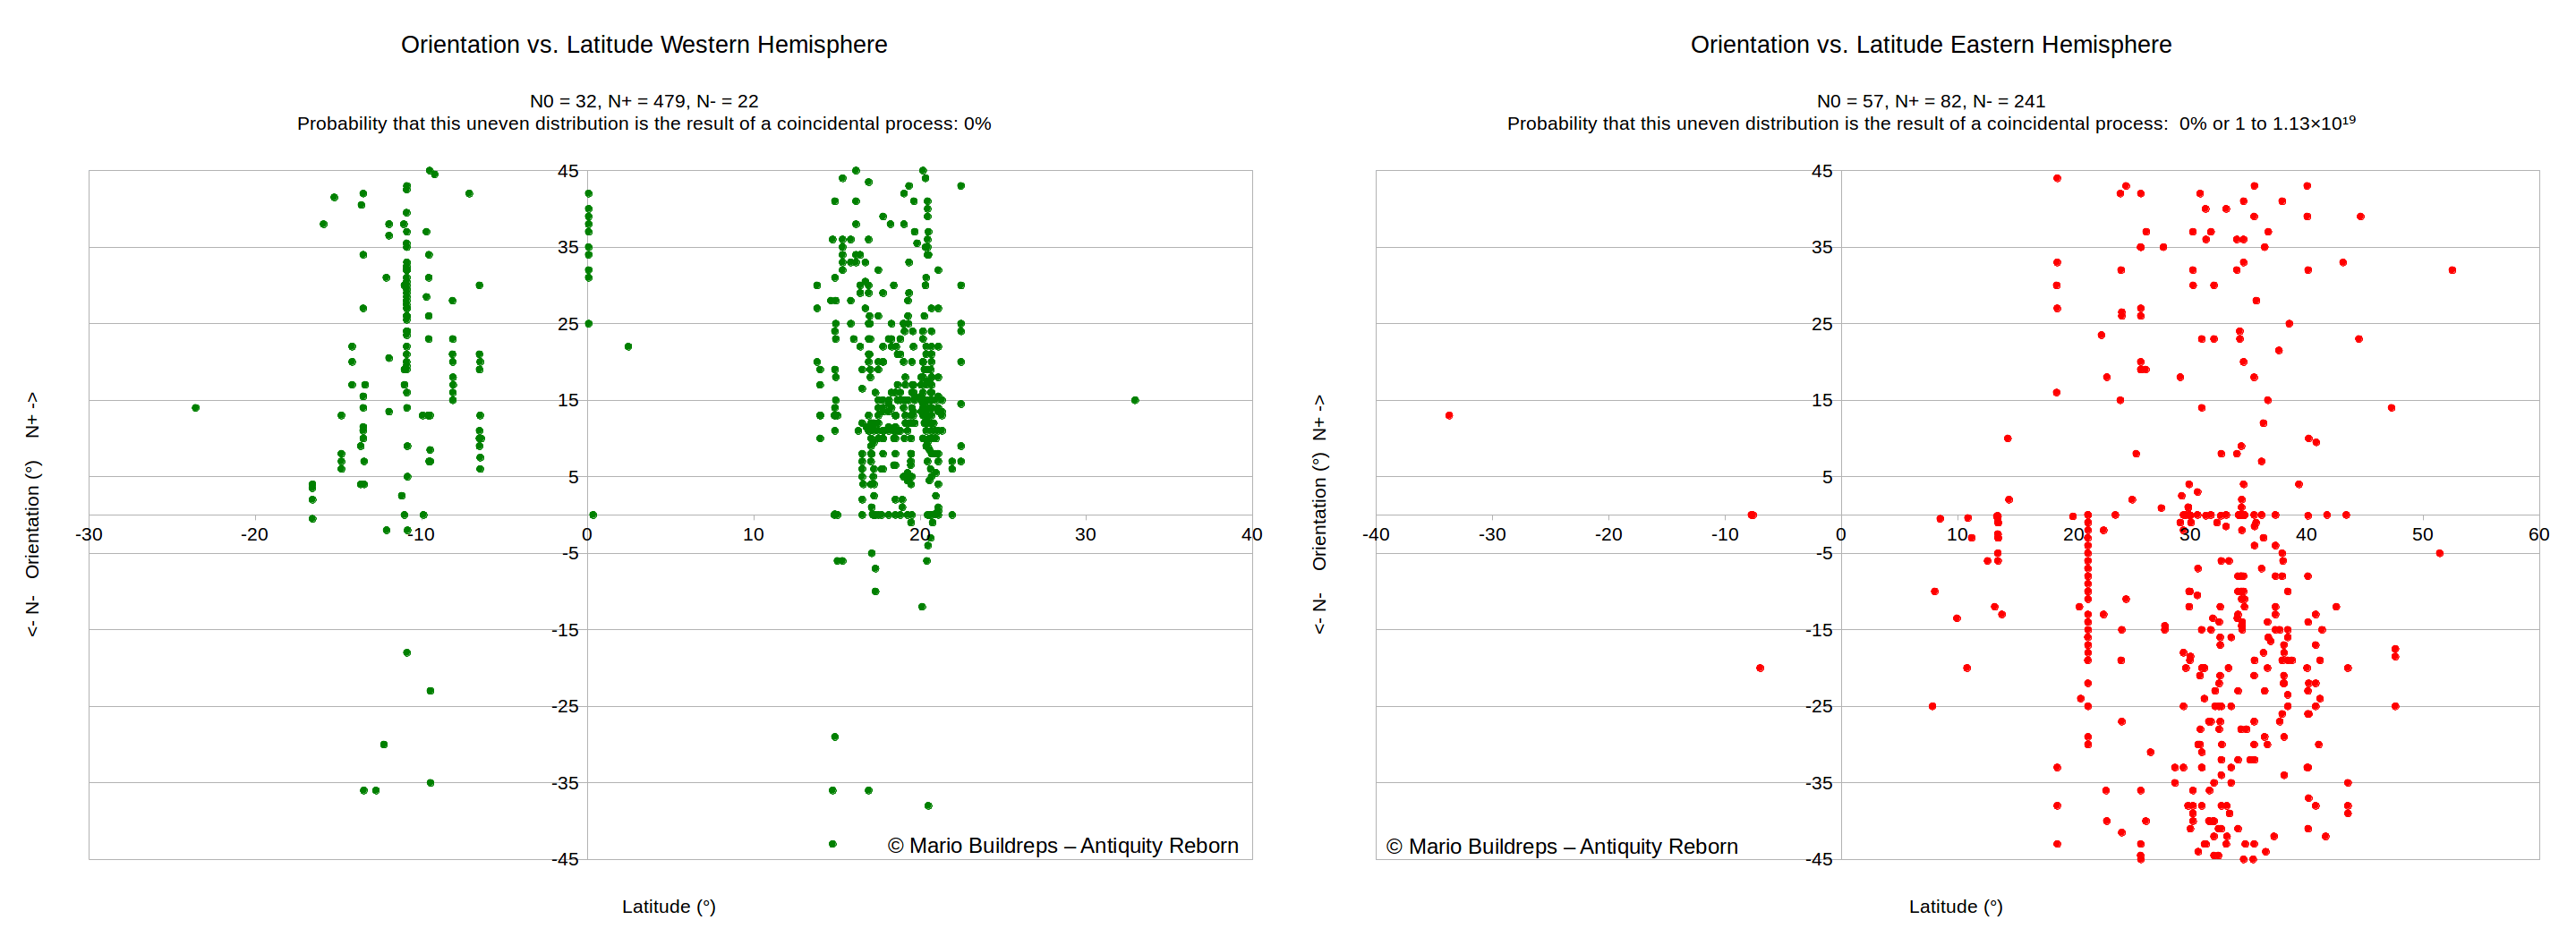


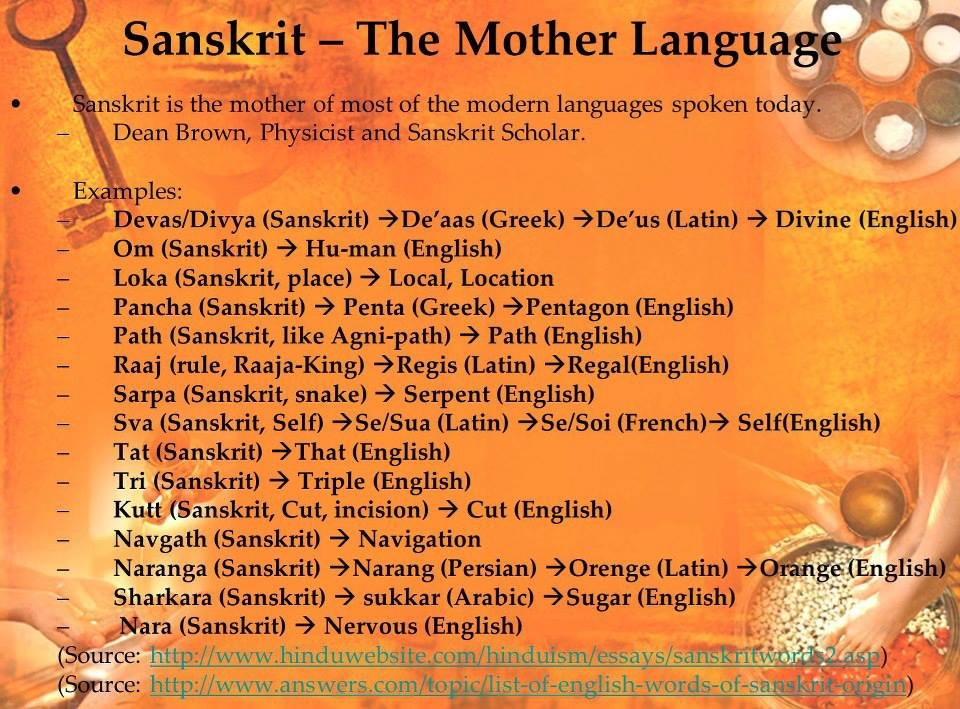

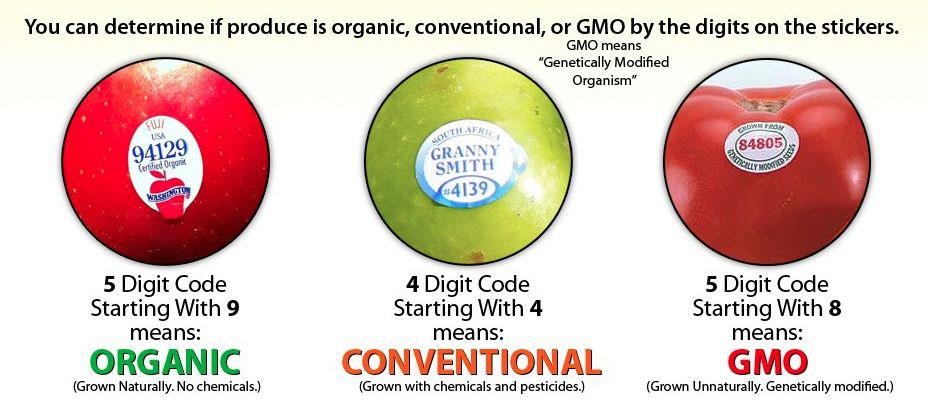
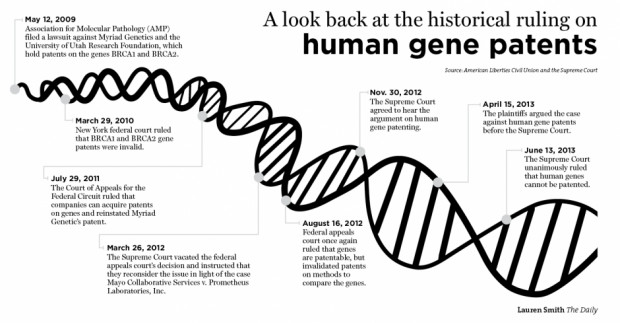
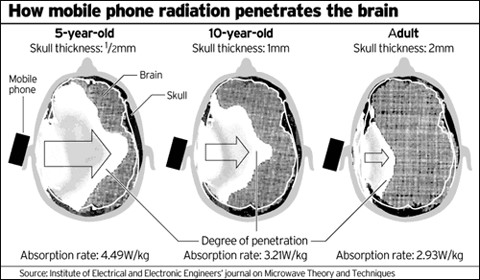

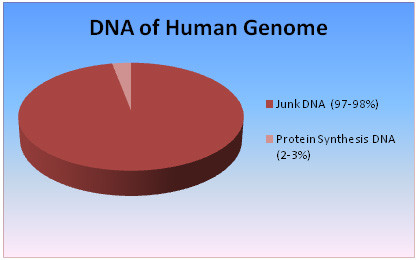
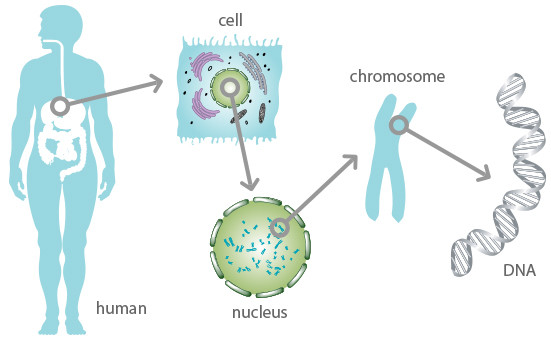


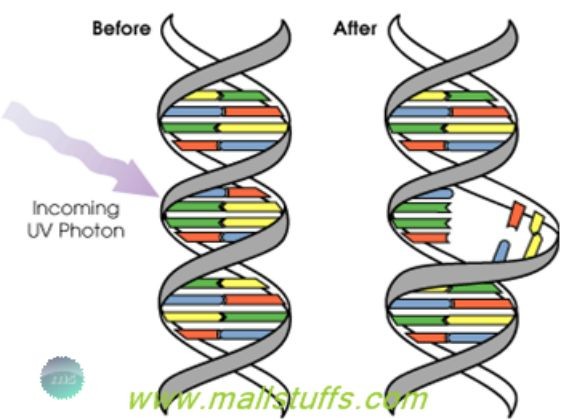


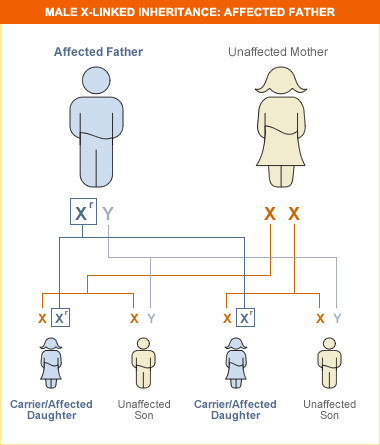
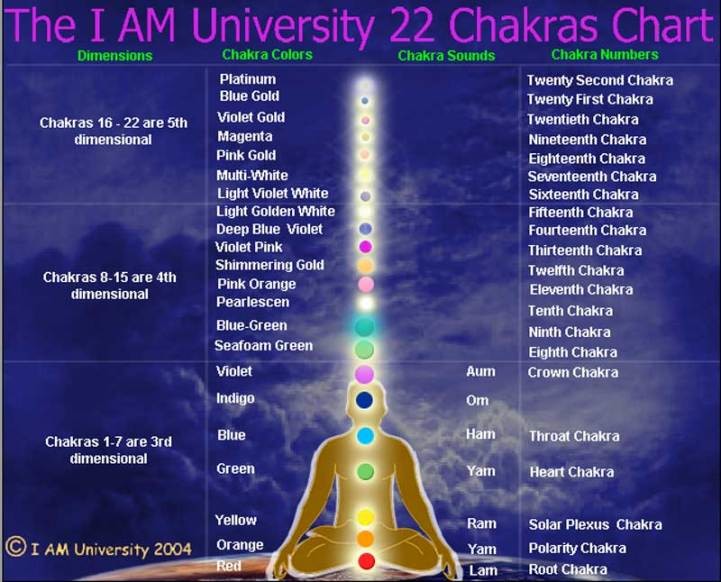


