The Sun Is Asleep. Deep ‘Solar Minimum’ Feared As 2020 Sees Record-Setting 100-Day Slump

List members , it's getting closer & closer to us...a mild , mini ice age (that will last only a few decades) is approaching . For the first time , a mainstream magazine like Forbes has carried this story , which means the "Powers that be" , have FINALLY allowed this news to come into full public view ! For those still sceptical about the inevitability of this phenomena , just wait till 21st June , when a Solar eclipse is due . This also serves as a strong validation for the electric plasma nature of our Hollow Sun !!

During this Solar eclipse of 21st June 2020 , called the "Solstice Ring of Fire Eclipse", astronomers will get an excellent opportunity to view and study the Sun's Corona . The major reduction of activity in the Sun's Corona will then become obvious to all - so we can just forget everything about Global warming for the next few decades , but of course , continue to fight manmade pollution of our environment .

**Yes , our world is already under lockdown due to the Covid-19 pandemic , but it's best to be prepared for what else could happen in the not so distant future...

The Sun Is Asleep. Deep ‘Solar Minimum’ Feared As 2020 Sees Record-Setting 100-Day Slump

Science

I write about science and nature, technology and travel, stargazing and eclipses.

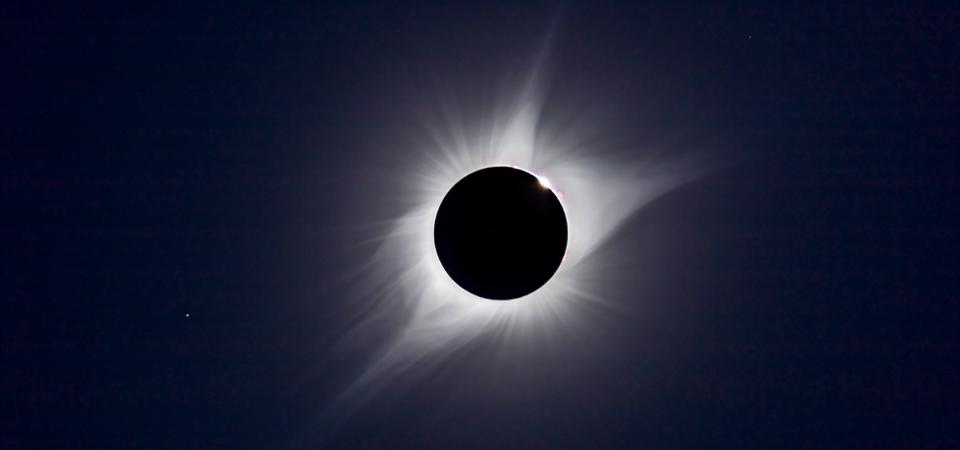
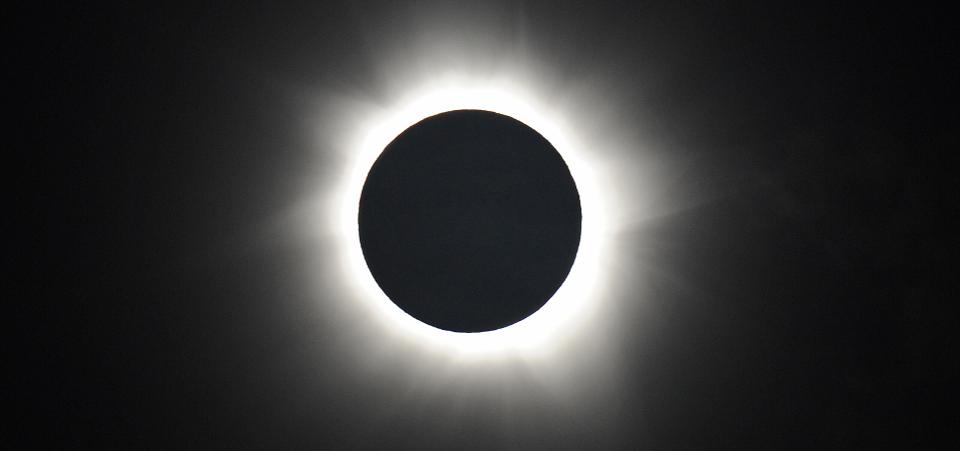
A composite of the August 21, 2017 total solar eclipse showing third contact Ð the end of totality ... [+]

Universal Images Group via Getty Images

While we on Earth suffer from coronavirus, our star—the Sun—is having a lockdown all of its own. Spaceweather.com reports that already there have been 100 days in 2020 when our Sun has displayed zero sunspots.

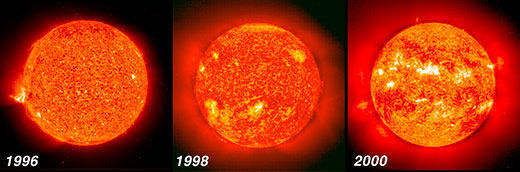
That makes 2020 the second consecutive year of a record-setting low number of sunspots— which you can see (a complete absence of) here.

Note: never look at the Sun with the naked eye or through binoculars or a telescope that aren’t fitted with solar filters.

So are we in an eternal sunshine of the spotless kind ?

The sun is blank--no sunspots.

“This is a sign that solar minimum is underway,” reads SpaceWeather.com. “So far this year, the Sun has been blank 76% of the time, a rate surpassed only once before in the Space Age. Last year, 2019, the Sun was blank 77% of the time. Two consecutive years of record-setting spotlessness adds up to a very deep solar minimum, indeed.”

What does all of this mean? Here’s everything you need to know about the Sun, the solar cycle, and what a deep solar minimum means for us.

What is a sunspot?

It’s an area of intense magnetic activity on the surface of the Sun—a storm—that appears as an area of darkness. Sunspots are indicative of solar activity, birthing solar flares and coronal mass ejections (CMEs). Although sunspots seem like tiny specks, they can be colossal in size.

Sunspots have been continuously counted each day since 1838, which has allowed solar scientists to describe a repeating pattern in the wax and wane of activity on the Sun’s surface—the solar cycle .

What is the solar cycle?

The Sun has a cycle that lasts between nine and 14 years—typically 11 years, on average—and right now we’re in the trough. At the peak of that cycle—called solar maximum—the Sun produces more electrons and protons as huge solar flares and coronal mass ejections.

From a visual perspective, the solar cycle is a “sunspot cycle” since solar scientists can gauge where the Sun is in its cycle by counting sunspots on its surface.

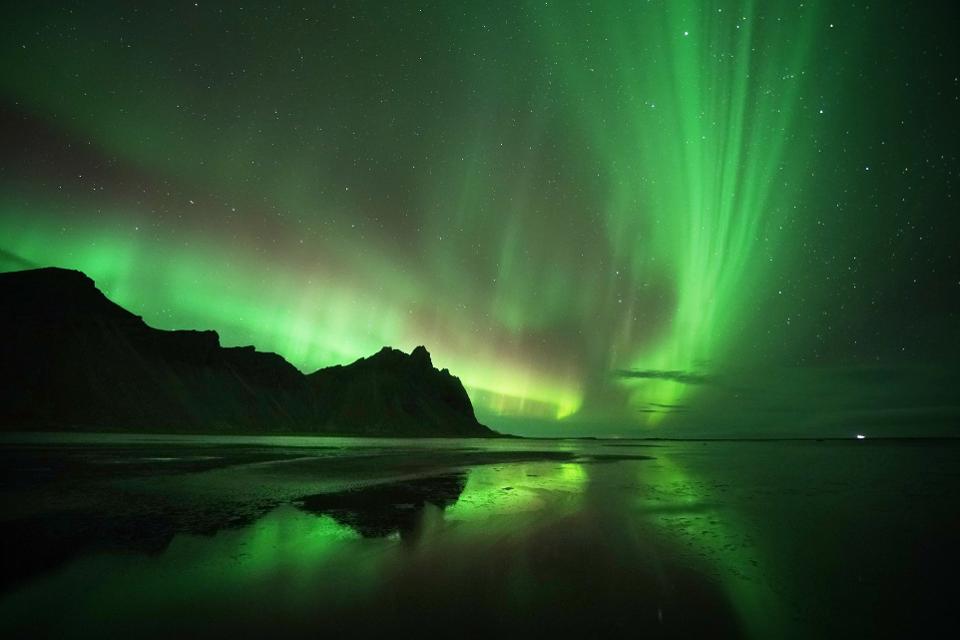
Aurora Borealis, the Northern Lights, over the Vestrahorn mountain in the east of Iceland. (Photo by ... [+]

PA Images via Getty Images

How does the solar cycle affect Earth?

While there’s some evidence that the solar cycle affects Earth’s weather and climate, the status of the Sun has the most obvious effect on the intensity and frequency of aurora. The more charged-up the solar wind headed towards Earth, the brighter and more frequent are the displays of Northern Lights and Southern Lights. What’s known as the ‘auroral oval’ gets larger, too, so people who live in areas that normally don’t experience aurora—such as the USA and Western Europe—sometimes get to see them.

Either way, a solar maximum is historically when aurora are at their most frequent and spectacular.

MORE FROM FORBESHow To See A Bright 'Parade Of Planets' From Your Home: What You Can See In The Night Sky This WeekBy Jamie Carter

What is ‘solar minimum’?

Just as solar maximum sees many sunspots, the trough of solar minimum features zero sunspots—and that’s what’s going on now. However, it’s been continuing rather longer than expected, which means the Sun is in the midst of a particularly deep solar minimum. The most infamous happened between 1645 to 1715 when a “Maunder Minimum” saw a prolonged sunspot minimum when sunspots were very rare for an extended period.

The current record-breaking solar minimum is part of a longer pattern of wax and wane; in fact, it’s believed that the Sun may have been in a magnetic lull for the last 9,000 years at least.

MORE FROM FORBESHere Is The Newest Most Detailed Image Of The Sun Ever (And It Could Save Your Life)By Jamie Carter

When is the next ‘solar maximum?’

It’s thought that the Sun will reach solar maximum in the mid-2020s, though exactly when sunspot frequency will peak is anyone’s guess. It’s something that can usually only be described in retrospect. The last solar maximum was in 2013/2014, but was was ranked among the weakest on record.

Once way to gauge what’s going on visually is by counting sunspots—and the other is by looking at the Sun’s mighty corona during a total solar eclipse.

Luckily, there’s one coming up in North America right on cue.

MORE FROM FORBES50 Million People May Gather For The 'Greater American Eclipse,' The Most Watched Event EverBy Jamie Carter

How the solar cycle affects solar eclipses

During a total solar eclipse it’s possible to see clear, naked eye evidence of where the Sun is in its cycle. Totality—when the Moon completely blocks the Sun’s bright disk—affords a brief view of the Sun’s corona, its hot outer atmosphere. During solar minimum the corona is relatively small and tightly bound to the surface. During solar maximum, the Sun’s corona is typically flared and stretching away into space.

Totality is shown during the solar eclipse at Palm Cove in Australia's Tropical North Queensland on ... [+]

AFP via Getty Images

How to see explosions on the Sun

When the Sun is at solar maximum the likelihood is increased of seeing prominences—huge solar flares and coronal mass ejections in action—around the limb of the Moon during a total solar eclipse.

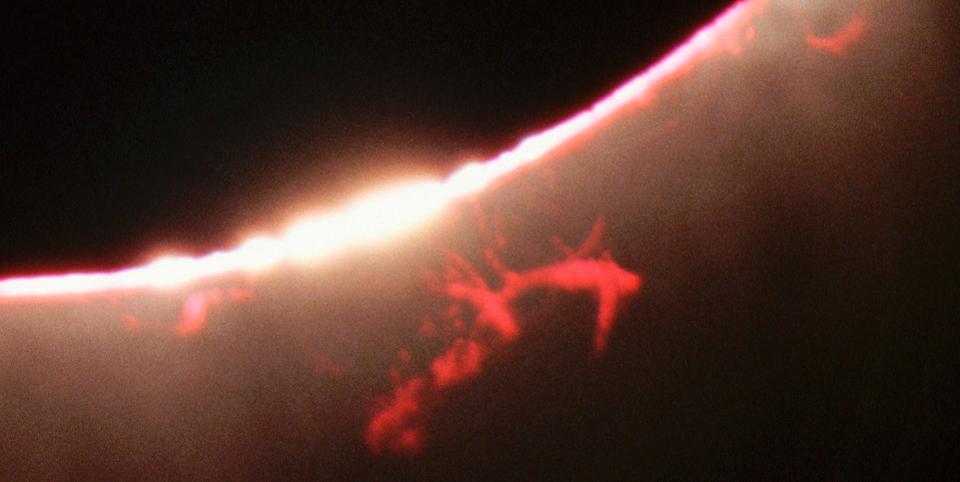
A close-up view of the Sun's disk during a total eclipse reveals fiery solar prominences. | View ... [+]

Corbis/VCG via Getty Images

Here’s an image (above) of some pink prominences that can be seen with the naked eye only during a total solar eclipse.

Why is this good news for North American eclipse-chasers?

All of this is well-timed for the next total solar eclipse in North America on April 8, 2024, since the Sun will, by then, be approaching solar maximum.

The 100-mile wide path of totality will, during the 139 minutes it’s over land, afford a stunning view (if skies are clear) of a flared and stretched corona from anyone within under the Moon’s shadow in:

MORE FROM FORBESThree Eclipses, Two Meteor Showers And A Supermoon: A Stargazer's Guide To Looking Up In LockdownBy Jamie Carter

Mexico: Sinaloa, Durango and Coahuila

U.S: Texas, Oklahoma, Arkansas, Missouri, Illinois, Kentucky, Tennessee, Michigan, Indiana, Ohio, Pennsylvania, New York, Vermont, New Hampshire and Maine.

Canada: Ontario, Quebec, New Brunswick, Prince Edward Island and Newfoundland.

Wishing you clear skies and wide eyes.

Sun Flatlining Into Grand Minimum, Says Solar Physicist

This article is more than 6 years old.

With each passing season, the weather seems stranger and more extreme.

Who can argue with a sudden outbreak of the “polar vortex” phenomenon; unprecedented winter drought in California; and summer temperatures so torrid Down Under that even play at the Australian Open was briefly halted?

Is any of this connected to the sun’s drastically diminished recent sunspot cycles?

Weather isn’t climate, but circumstantial evidence indicates our sun may be entering a grand minimum of sunspot activity, not unlike the Maunder Minimum that some climatologists think caused record low winter temperatures in Northern Europe during the latter half of the 17th century.

“My opinion is that we are heading into a Maunder Minimum,” said Mark Giampapa, a solar physicist at the National Solar Observatory (NSO) in Tucson, Arizona. “I’m seeing a continuation in the decline of the sunspots’ mean magnetic field strengths and a weakening of the polar magnetic fields and subsurface flows.”

Theoretical details of how sunspots are actually produced continue to be debated. But one popular idea is that they are generated as the result of concentrated and twisted solar magnetic fields blocking internal convection in the outer third of the sun’s interior. This, in turn, gives the sunspots their dark appearance, since on average they are 2000 degrees cooler than the surrounding solar plasma.

First official sunspot belonging to the So...

First official sunspot belonging to the Solar Cycle 24. (Photo credit: Wikipedia)

The Shared Value Of Inclusive Economic Recovery

These solar magnetic fields are thought to be triggered by the sun’s own internal “differential rotation.” That is, the fact that at various latitudes and depths, the sun's gaseous plasma rotates at different rates. Then once these fields are produced, some theorists think it's their interaction at the sun’s photosphere (or surface) that plays a crucial role in sunspot creation.

Even so, David Hathaway, a solar physicist at NASA Marshall Space Flight Center in Huntsville, says it’s the actual strength of such magnetic fields at the end of a given maximum 11-year sunspot cycle that is thought to act as a bellwether for the size and strength of the next solar maximum.

“At the end of a sunspot cycle about all you have left are magnetic fields at the solar poles,” said Hathaway. “We’re at the sunspot maximum of Cycle 24. It’s the smallest sunspot cycle in 100 years and the third in a trend of diminishing sunspot cycles. So, Cycle 25 could likely be smaller than Cycle 24.”

Another indicator pointing to an imminent grand minimum is that the current solar cycle shows some signs of hemispheric asymmetry, says Steve Tobias, an applied mathematician at the University of Leeds in the U.K.

“When the field is about to enter a minimum or is leaving a minimum,” said Tobias, “we see more sunspots in one solar hemisphere than the other.”

Yet during the 1645 --- 1715 Maunder Minimum itself, sunspots basically disappeared and as documented in paintings from the era, Northern Europe suffered unusually cold winter temperatures.

Such minima are thought to be a part of the normal life of a sunlike star, however. And from recent surveys of several solar analogues in the open stellar cluster M67, Giampapa and colleagues see indications that such grand minima take place up to 15 percent of the time.

Hathaway says that the observed effects of the sunspot cycle in radioisotopes; in ice cores; and in tree rings indicate that some 10 to 15 percent of the time the sun is in “something like a Maunder Minimum.”

This Bruegel painting ″The Hunters in the Snow″ is reminiscent of winter landscapes typical in Northern Europe during the Maunder Minimum. (Photo credit: Wikipedia)

This Bruegel painting "The Hunters in the Snow" is reminiscent of winter landscapes typical in... [+]

“If we’re entering a Maunder Minimum, it could persist until the 2080s,” said Giampapa, who points out that if such a minimum’s primary effect is cooling, it could wreak havoc by curtailing agricultural growing seasons which, for instance, could lead to lower wheat production in breadbasket economies.

But Giampapa says it could also mean a global excursion from the mean, resulting in local climate extremes in terms of both anomalous temperatures and precipitation.

Could a Maunder Minimum mitigate a warming climate?

Not likely, says Hathaway.

Although the rise of global temperatures seen in “the last decade or so seems to have currently leveled off,” says Hathaway, he notes that even a Maunder Minimum would still not be enough to counter the warming effects of anthropogenic climate change.

If anything, a Maunder Minimum may simply make existing weather and short term climate even more unusual and difficult to predict.

Regards

Folks , the first of the 2 articles in my above post was dated 12th May , 2020 . Now flash back from there 100 days - you get to Jan. end....so what's the significance of this 100 day slump in solar activity , that this article referred to ??

What happened around Jan. end this year ? Hmm , you guessed right : the start of the Global Coronavirus Pandemic . Now , is there a correlation between a Grand Solar Minimum and global pandemics , especially of the Influenza type ? This is a CRITICAL question that once again proves how COSTLY it can be to mankind if we get our science wrong and don't make efforts to bring it back on track !

Well , if you're thinking what's the connection between these 2 unrelated events , then think again . It turns out , that when our Sun takes a slight breather , it pumps less radiation towards the Earth . Some of that radiation is good , some bad like UV rays . However , UV rays also KILL viruses and bacteria . Three things happen , when a Solar Grand minimum occurs -

  1. The Earth's magnetic field weakens (which is also currently going on)
  2. With it's cosmic "shield" down and it's "protector" (the Sun) in hibernation , more cosmic rays start hitting our planet Earth , these also rain down with viruses and microbes , otherwise floating harmlessly in the upper atmosphere
  3. Even ordinary viruses , such as those of the Coronavirus family , become super virulent and start mutating dangerously

This prophetic article below came on 8th Dec. 2018 , but nobody noticed at that time ((:

This grand solar minimum increases the risk of a pandemic influenza outbreak

by Carlton | Dec 8, 2018 | 0 comments

Grand solar minimum periods associated with a colder climate pose increased risks for pandemic infuenza outbreaks. In fact, half of all pandemic influenza outbreaks between 1600 and 2000 CE occurred when both the Northern Hemisphere temperature and total solar irradiance levels were below the 1600-2000 CE average, which corresponded with the grand solar minimum periods of the Little Ice Age.

Figure B) above. Historical pandemic influenza outbreak data was extracted from six scientific publications reviewing the history of influenza, providing a general consensus on pandemic flu outbreaks (and major regional epidemics) back to 1500. These were plotted against the total solar irradiance and Northern Hemisphere temperature data reconstructions. See the citation for all the data.[i] Between 1610 and 2000, eighty-two percent of influenza pandemics and epidemics (37/45) occurred at or within one year of a peak or trough in the total solar irradiance anomaly. At the same time, sixty-four percent (29/45) of influenza pandemics and epidemics occurred during a negative Northern Hemisphere temperature anomaly.

Half of outbreaks (22/45) between 1600 and 2000 CE occurred when both the Northern Hemisphere temperature and total solar irradiance anomaly were negative, which corresponded with the trough of grand solar minimum periods (during the Little Ice Age). Negative anomalies resulted when the temperature or irradiance value was less than the 1610-2000 average for that parameter.

The obvious conclusion is that grand solar minimum periods associated with a colder climate pose increased risks for pandemic flu outbreaks. The sun is plummeting into the depths of this grand solar minimum and in 2016 the Northern Hemisphere temperatures started to decline.[ii]

We should be VERY WORRIED that governments, the vaccine industry, and WHO will not be able to immunize the world before the peak of a pandemic, or supply sufficient vaccine in an equitable manner. We have the vaccine technology to solve this problem but this has not been implemented since 2009’s swine flu pandemic. Read Chapter 14 to find out why we are left fully vulnerable to a bad pandemic outbreak.

Click on this page and download a free copy of my book “Revolution: Ice Age Re-Entry,” and read more about this topic in Chapter 14.

***The following article that appeared on 25th Jan. this year , had also got it right , but once again , it was mostly ignored by governments around the world , with fatal consequences for so many unfortunate victims of this Coronavrius pandemic !

Coronavirus

CORONAVIRUS could spread into a global pandemic due to a freak slump in solar activity, with experts warning of a spike in "potentially deadly viruses".

By Nathan Rao

The “deepest sunspot minimum” for more than a century is about to force the Sun into partial hibernation, they say. Public health authorities have been warned to be vigilant with the phenomenon linked to historic viral pandemics. Previously unseen strains could emerge through the coming months while existing ones turn super-virulent, according to a report in Current Science. The news comes as Coronavirus rips through China, rapidly infecting more than 800 people.
While not naming Coronavirus specifically as being caused by the solar minimum, experts say the weaker magnetic field caused by the drop in sunspots gives ground for new viruses to emerge.

Lead author Chandra Wickramasinghe, of the Buckingham Centre for Astrobiology, said: “A global virus pandemic is imminent.

“On the basis of sunspot numbers, this could have serious consequences globally during the coming months.”

The solar slump is causing the Earth’s magnetic field to weaken allowing “biological entities” including DNA to fall to the planet’s surface.

Coronavirus risks turning into global pandemic as freak solar minimum means outbreak ‘imminent’ (Image: AFP•GETTY)

Scientists believe infective agents originating from comets and other planets inhabit near space in a type of soup – the so-called panspermia theory.

While they can naturally drift towards Earth, they are largely held at bay by magnetic fields which are strengthened by solar activity.

The imminent reduction in solar activity will knock a chink in this armour while “opening the floodgates” to a "flux of cosmic rays”.

These rays threaten to disrupt the DNA present in bacteria and viruses already present, creating super-virulent versions.

Professor Wickramasinghe said: “There are two problems we fear may arise.

“Biological entities can penetrate the weakened magnetic field under these circumstances to a much greater degree than under normal conditions.

DONT MISS
‘Like Walking Dead’ Coronavirus hell as corpses litter hospitals [VIDEO]
Coronavirus latest: What you can do to prevent deadly virus spreading [EXPERT]
Coronavirus: Shadowy lab for world’s deadliest diseases in Wuhan [EXCLUSIVE]

Coronavirus map: Coronavirus has spread rapidly from China (Image: EXPRESS)

“So we could see new, potentially deadly viruses, emerge on Earth after these floodgates are opened.

“Another aspect is mutations induced by cosmic rays in biological infectious agents already here, this could give them new characteristics and making then super-virulent.

“It would be prudent for public health authorities the world over to be vigilant and prepared for any necessary action.”

Previous viral pandemics have coincided with periods of low solar activity although scientists have struggled to find a definitive link.

However they now think the effect of the sun on magnetic fields affects solar winds and the flow of charged particles including bacteria and viruses.

Professor Wickramasinghe said: “Now, with space exploration and continuous monitoring of space weather, it is evident that the Earth’s magnetosphere and the the interplanetary magnetic filed in its vicinity, are modulated by the solar wind that in turn controls the flow of charged particles onto the Earth.

“There appears to be a case for expecting new viral strains to emerge over the coming months.

“There are many claims that the occurrence of pandemic influenza and other viral outbreaks is correlated with the 11-year sunspot cycle.

“We need hardly be reminded that the spectre of the 1918 devastating influenza pandemic stares us in the face from across a century.”

However Dr Martin Wiselka, an infectious diseases consultant at the University of Leicester NHS Trust, dismissed the claims, saying: “There are lots of things to worry about but I don’t think this is one of them.

“While there may be some truth in the theory of bits of DNA and viruses floating around space, there is no real evidence to support this, I think it just doesn’t happen.
“We have got perfectly good explanations of how the coronavirus travels between the animal reservoir and the human reservoir ."

Regards

List members , Solar cycle no. 24 just ended and a "weakened" Solar cycle 25 has started up in 2020 .

However , if the Double Dynamo model of the Sun is correct (it aligns with the data upto 97% accuracy) , then Solar cycle no. 26 which begins in about 2031 is the one to really watch out for...the decade of the 2030s could bring weather similar to the Maunder minimum experienced from the year 1645 to 1715 . It's better to be clear on the science behind this subject...

**I tried several times to google on "Solar Cycle 26" , but most of the articles yield "Error 404"...hmm - that's a smoking gun for sure !!

The Sun and the next 'Maunder Minimum' 2030-2040?

Weather Eye
with John Maunder

A new model of the Sun’s interior is producing predictions of its behaviour with unprecedented accuracy; predictions with interesting consequences for Earth. Professor Valentina Zharkova of Northumbria University presented results for a new model of the Sun’s interior dynamo in a talk at the Astronomical Society meeting last week. (https://astronomynow.com/2015/07/09/royal-astronomical-societys-national-astronomy-meeting-2015-report-4/)

The Sun has an approximately 11-year activity cycle. During peak periods, it exhibits lots of solar flares and sunspots. Magnetic bubbles of charged particles (coronal mass ejections) may burst from the surface during this period, streaming material into space. These ejections can affect satellites and power lines on Earth. However, during lull periods, such activity may almost stop altogether. But the 11-year cycle isn’t quite able to predict all of the Sun’s behaviour — which can seem erratic at times. Zharkova and her colleagues (Professor Simon Shepherd of Bradford University, Dr Helen Popova of Lomonosov Moscow State University, and Dr Sergei Zarkhov of Hull University) have found a way to account for the discrepancies called a ‘double dynamo’ system.

The Sun, like all stars, is a large nuclear fusion reactor that generates powerful magnetic fields, similar to a dynamo. The model developed by Kharkov's team suggests there are two dynamos at work in the Sun; one close to the surface and one deep within the convection zone. They found this dual dynamo system could explain aspects of the solar cycle with much greater accuracy than before — possibly leading to enhanced predictions of future solar behaviour. “We found magnetic wave components appearing in pairs; originating in two different layers in the Sun’s interior. They both have a frequency of approximately 11 years, although this frequency is slightly different [for both] and they are offset in time,” says Zharkova. The two magnetic waves either reinforce one another to produce high activity or cancel out to create lull periods.


Comparison of three images over four years apart illustrates how the level of solar activity has risen from near minimum to near maximum in the Sun’s 11-years solar cycle. Image credit: SOHO/ESA/NASA.

Professor Zharkova and her colleagues used magnetic field observations from the Wilcox Solar Observatory in California for three solar cycles, from the period of 1976 to 2008. In addition, they compared their predictions to average sunspot numbers — another strong marker of solar activity. All the predictions and observations matched closely. Their predictions using the model suggest an interesting longer-term trend beyond the 11-year cycle.

It shows that solar activity is expected to fall by 60 % during the 2030’s, to conditions last seen during the ‘Maunder Minimum*’ of 1645-1715. “Over the cycle, the waves fluctuate between the Sun’s northern and southern hemispheres. Combining both waves together and comparing to real data for the current solar cycle, we found that our predictions showed an accuracy of 97 %,” says Zharkova.

The model predicts that the magnetic wave pairs will become increasingly offset during the Solar Cycle 25, which peaks in 2022. Then during Cycle 26, which covers the decade from 2030-2040, the two waves will become exactly out of synch, cancelling one another out. This will cause a significant reduction in solar activity. “In Cycle 26, the two waves exactly mirror each other, peaking at the same time but in opposite hemispheres of the Sun. We predict that this will lead to the properties of a ‘Maunder minimum’,” says Zharkova.

The sun was well observed during the period of the original “Maunder Minimum” and this lack of sunspots is well documented.This period of solar inactivity corresponded to a climatic period called the ‘Little Ice Age' when in Europe rivers that were normally ice-free, froze and snow fields remained at low altitudes throughout the year. There is evidence the sun had similar periods of inactivity during the years 1100-1250 and 1460-1550.

The connection between solar activity and the earth's climate is an area of ongoing and sometimes controversial research.Time will tell whether the sun will once again go into another “Maunder Minimum” within the lifetime of the present generation, and what affect it will have on our climate.

*The "Maunder Minimum" is the name given to the period from 1650 to 1700 when the number of sunspots became almost zero. The period is named after the solar astronomer Edward Walter Maunder (1851-1928) who while working at The Royal Observatory, Greenwich discovered the dearth of sunspots during the 1650-1700 period.

During one 30 year period within the Maunder Minimum there were only about 50 sunspots compared with a more typical 40,000. Maunder was a driving force in the foundation of the British Astronomical Association, and was a fellow of the Royal Astronomical Society.

For further information on a variety of weather and climate matters see: https://sites.google.com/images/theclimatedice/

Regards

Folks , I just double checked and the url at the end of my above post also yields "Error 404" . Hmmm...very interesting indeed !

Regards

Folks , with just 12 days to go for the upcoming Solar eclipse , due on 21st June , astronomers are gearing up to study the Sun's Corona during the eclipse . That should give a lot of clarity about the current stage of the ongoing Solar cycle no. 25 and facilitate even more accurate projections about Solar Cycle no. 26

Regards

Sidhartha,

Visibility of eclipse map:

https://www.timeanddate.com/eclipse/map/2020-june-21

Regards to you ...

@deandddd , here is a very useful tool , that's been devised to better understand Solar cycles :-

https://news.ucar.edu/132738/new-sun-clock-reveals-solar-activity-turns-and-surprising-precision

New ‘Sun clock’ reveals that solar activity turns off and on with surprising precision

Clock paints picture of a more orderly, predictable Sun

Jun 10, 2020 - by Laura Snider

The Sun clock constructed by the research team. The maxima and minima of the last 18 solar cycles are indicated by red and green circles, respectively, and the blue circles indicate terminators for the last 12 solar cycles. Black lines indicate the maxima, minima, and terminators. (Image: Scott McIntosh, NCAR)

Solar scientists have taken a mathematical technique used by Earth scientists to analyze cyclic phenomena, such as the ebb and flow of ocean tides, and applied it to the confounding irregularity of cycles on the Sun. The result is an elegant “Sun clock” that shows that solar activity starts and stops on a much more precise schedule than could be discerned when looking at observations of the Sun in the traditional way – plotted linearly over time.

The new research, published in the journal Geophysical Research Letters , was led by the University of Warwick in England and involved researchers from the National Center for Atmospheric Research (NCAR) and NASA.

Solar cycles – marked by the rhythmic waxing and waning of activity on the Sun – occur every 11 years on average, but they can last years longer or shorter. They also vary in their strength. While they all build from a quiet start toward the cycle’s solar maximum before quieting again, the magnitude of that maximum can change significantly from cycle to cycle. During and after solar maximum, the Sun is more likely to produce space weather that can impact Earth, damaging satellites, scrambling radio communications, and disrupting power grids, among other impacts. The new sun clock could be used as a planning tool to help keep space- and ground-based infrastructure safe.

The clock was created using a technique known as the Hilbert transform to convert the linear observations of past solar cycles onto a circle, stretching and shrinking the cycles as necessary to a standard 11 years. As the cycles were overlaid on top of each other on the clock’s face, distinct “times” on the clock face when solar activity is flipped on and off came into focus.

“Scientists spend their lives trying to read the book of nature,” said Sandra Chapman, a professor at the University of Warwick who led the study. “Sometimes we create a new way to transform the data, and what appeared to be messy and complicated is suddenly beautifully simple. In this instance, our Sun clock method showed clear switch on and switch off times demarcating quiet and active intervals for space weather for the first time.”

The idea of applying a Hilbert transform to sunspot data was born out of a chance meeting at a conference in 2018, when Chapman, a plasma physicist, suggested that co-author Robert Leamon, a NASA scientist, apply the transform to help make sense of another project he was working on that involved the cyclic nature of El Niño.

“The Hilbert transform is a really powerful technique across all of science," said Leamon, also of the University of Maryland. "When we applied it to sunspots, we saw it tied to the sharp switch-on of activity that we'd seen elsewhere. Further analysis of the geomagnetic data revealed the switch off as well."

The creation of the solar clock is part of a larger body of research that makes a case that the Sun’s cycles are far more predictable and regular than scientists realize. For example, Leamon and study co-author Scott McIntosh, NCAR deputy director, have identified “terminator” events on the Sun, which they say offer observational evidence of the start and stop of solar cycles, something that has been estimated in the past.

“The Sun is not nearly as irregular as we thought,” McIntosh said. “But we’ve been looking in the wrong places. Once you realize that the Sun is actually adhering to a larger cycle, and that the appearance and disappearance of sunspots are just a symptom of that cycle, not the cycle itself, you see a beautiful order in the chaos. The striking regularity we find in this new sun clock is evidence of that.”

Read more about the study at the University of Warwick .

About the article

Title: Quantifying the Solar Cycle Modulation of Extreme SpaceWeather
Authors: S.C. Chapman, S.W. McIntosh, R.J. Leamon, and N.W. Watkins
Journal: Geophysical Research Letters

Regards