Reminds me of previous discussion/thoughts:
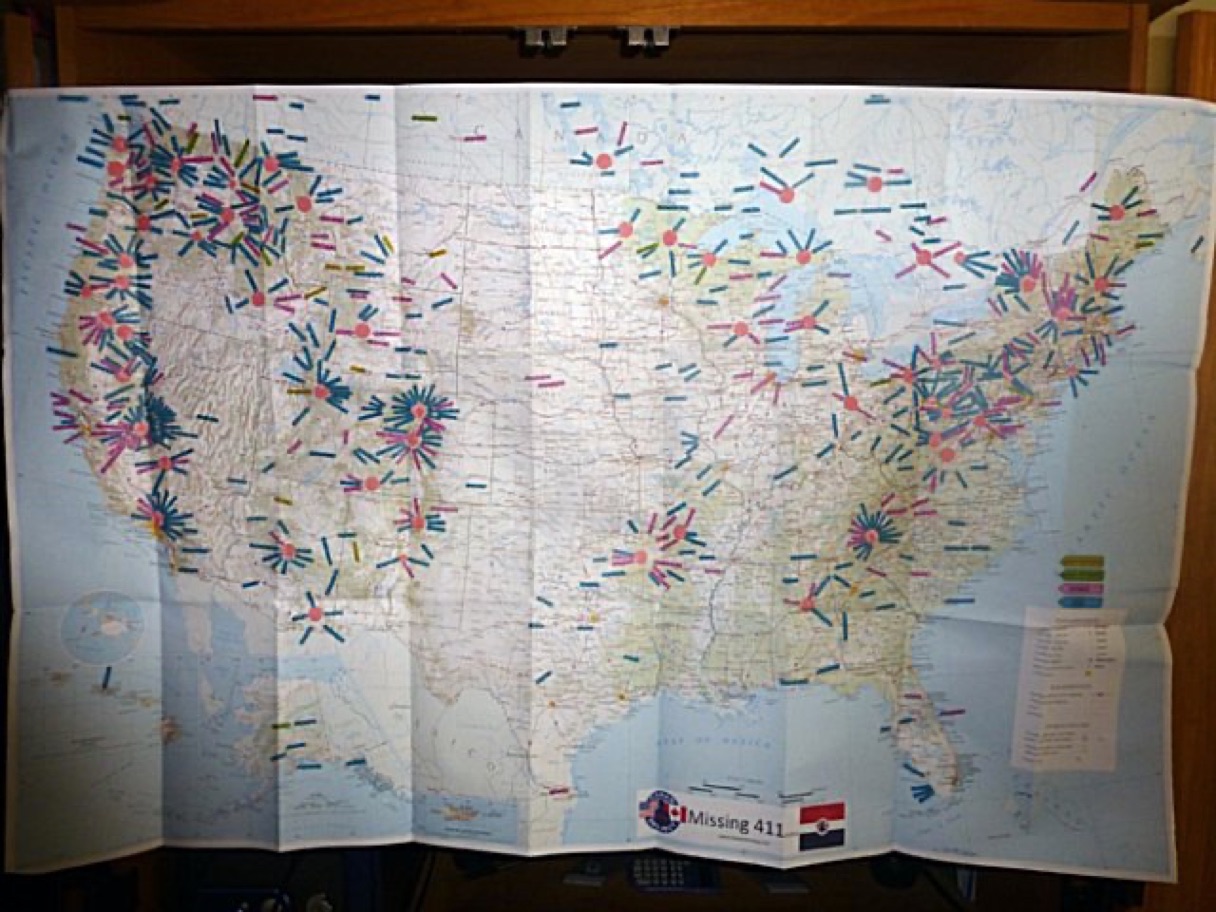
The homepage of the Missing 411 effort: https://www.canammissing.com/
Larger version of the missing persons marker map (here's a seeming older original map from above post):
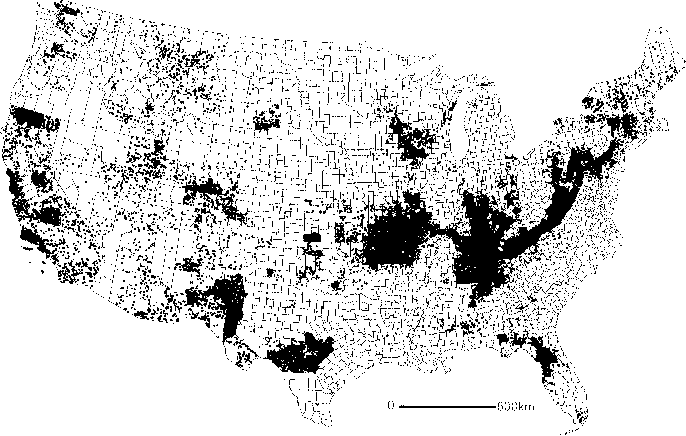
Compared to cave density map per county in USA (source provided below):
You may find this link in the comments interesting:
https://www.semanticscholar.org/paper/DISTRIBUTION-MAP-OF-CAVES-AND-CAVE-ANIMALS-IN-THE-Culver-Hobbs/46d1ba7a8c1df10f008949eb662789bb77a20bd9
DISTRIBUTION MAP OF CAVES AND CAVE ANIMALS IN THE UNITED STATES
- D. Culver, H. H. Hobbs, +1 author L. Master
- Published 1999
- Geography
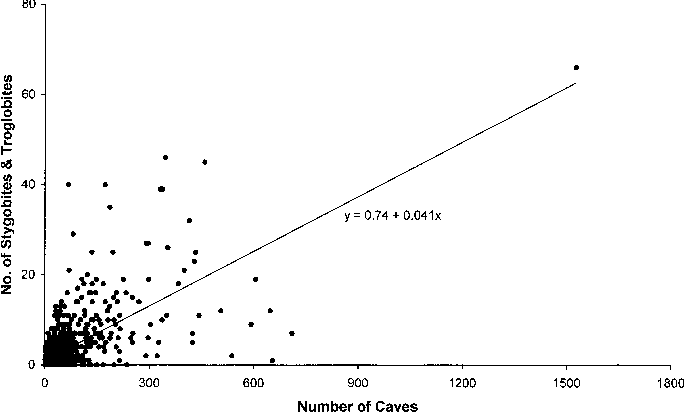
The distributions of nearly 45,000 caves and 924 obligate cave species and subspecies (stygobites and troglobites) in the 48 contiguous states of the United States were mapped by county. Both maps show a highly clumped distribution. Approximately one-half of the variance in the number of species in a county is explained by variance in the number of caves per county. While several maps of karst and pseudo-karst areas of the 48 contiguous states are available, most notably that of Davies et al. (1986) and its variants (Culver 1999), we know of no similar map of cave locations. We have a special interest in the distribution of caves since we have compiled a list of the obligate cave-dwelling species by county for each of the 3100 counties in the 48 contiguous states (available at www.karstwaters.org). In particular, we were interested in the explanatory power the distribution of caves has in accounting for the distribution of obligate cave-dwelling species. Therefore, we have assembled data on the number of caves by county, based on information in the National Speleological Society cave files and from records of state cave surveys. The list includes not only solution caves, but lava tubes, sea caves, etc. The purpose of this brief communication is to present dot maps of the distribution of caves by county and the distribution of obligate cave species by county, and briefly to compare the two. A more complete analysis of the spatial distribution of cave species will appear elsewhere at a later date. The maps presented below were generated using the Geographic Information System software package, MapView . Each cave (or species) in a county is represented by a dot so that, for example, a county with 10 caves has 10 dots. The position of the dot within the county is assigned at random by MapView . While this produces some loss of accuracy, it also ensures that no precise location information can be determined from the maps. For some counties, the number of caves is so great that the dots completely fill the county, and individual dots are indistinguishable and superimposed.
PDF: https://digital.lib.usf.edu/content/SF/S0/05/24/76/00001/K26-02027-v62n3-Christman.pdf
Figure 1. Dot map of the number of caves per county. Each dot represents one cave:
Figure 2. Dot map of the number of stygobites and troglobites per county. Each dot represents one county record of a stygobite or troglobite:
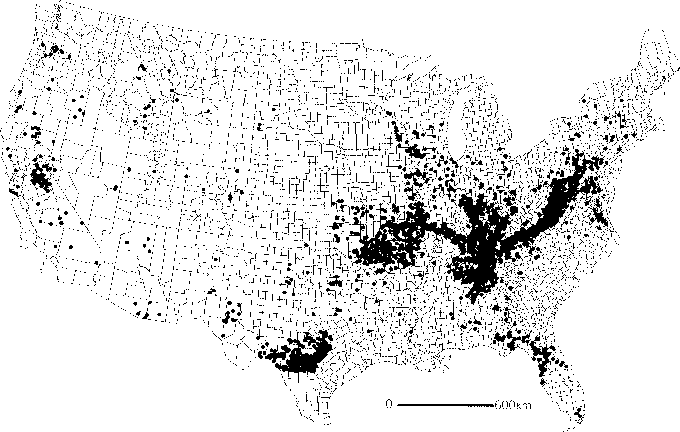
Figure. 3. Scatter plot of number of stygobites and troglobites versus number of caves for counties with one or more caves. The line is the least squares linear regression: